|
Download Data (XLS File) |
|
||||||||
|
||||||||
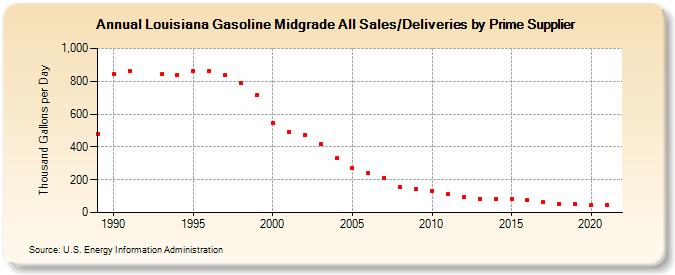
| Louisiana Gasoline Midgrade All Sales/Deliveries by Prime Supplier (Thousand Gallons per Day) | ||||||||
| Decade | Year-0 | Year-1 | Year-2 | Year-3 | Year-4 | Year-5 | Year-6 | Year-7 | Year-8 | Year-9 |
|---|---|---|---|---|---|---|---|---|---|---|
| 1980's | 480.3 | |||||||||
| 1990's | 844.0 | 859.3 | W | 842.0 | 839.6 | 864.7 | 859.5 | 836.4 | 786.3 | 713.6 |
| 2000's | 543.6 | 493.3 | 473.9 | 417.2 | 329.5 | 270.9 | 240.9 | 212.8 | 153.5 | 143.0 |
| 2010's | 133.6 | 112.7 | 95.4 | 84.4 | 81.5 | 82.6 | 76.2 | 62.0 | 53.6 | 49.2 |
| 2020's | 48.3 |
| - = No Data Reported; -- = Not Applicable; NA = Not Available; W = Withheld to avoid disclosure of individual company data. |
| Release Date: 6/1/2022 |
| Next Release Date: TBD |