|
Download Data (XLS File) |
|
||||||||
|
||||||||
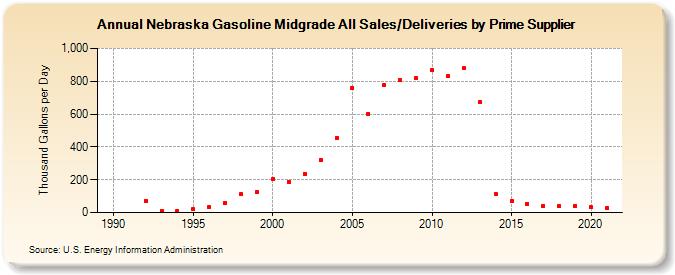
| Nebraska Gasoline Midgrade All Sales/Deliveries by Prime Supplier (Thousand Gallons per Day) | ||||||||
| Decade | Year-0 | Year-1 | Year-2 | Year-3 | Year-4 | Year-5 | Year-6 | Year-7 | Year-8 | Year-9 |
|---|---|---|---|---|---|---|---|---|---|---|
| 1980's | W | |||||||||
| 1990's | W | W | 72.4 | 11.4 | 9.6 | 19.3 | 34.7 | 60.2 | 111.5 | 126.6 |
| 2000's | 207.1 | 188.9 | 236.7 | 322.5 | 457.0 | 759.6 | 601.3 | 779.4 | 804.8 | 817.0 |
| 2010's | 867.2 | 830.5 | 877.8 | 670.8 | 113.8 | 69.4 | 52.6 | 42.2 | 39.2 | 41.2 |
| 2020's | 31.4 |
| - = No Data Reported; -- = Not Applicable; NA = Not Available; W = Withheld to avoid disclosure of individual company data. |
| Release Date: 6/1/2022 |
| Next Release Date: TBD |