|
Download Data (XLS File) |
|
||||||||
|
||||||||
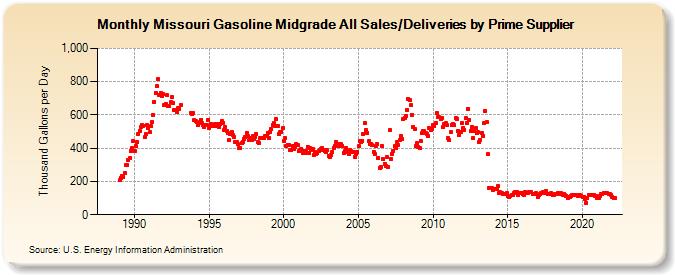
| Missouri Gasoline Midgrade All Sales/Deliveries by Prime Supplier (Thousand Gallons per Day) | ||||||||
| Year | Jan | Feb | Mar | Apr | May | Jun | Jul | Aug | Sep | Oct | Nov | Dec |
|---|---|---|---|---|---|---|---|---|---|---|---|---|
| 1988 | NA | NA | NA | NA | NA | NA | NA | NA | NA | NA | NA | NA |
| 1989 | 208.6 | 222.7 | 229.8 | 229.0 | 252.1 | 297.3 | 300.9 | 330.8 | 338.1 | 380.5 | 404.0 | 443.6 |
| 1990 | 384.3 | 412.6 | 437.4 | 483.8 | 503.3 | 525.8 | 539.0 | 536.3 | 464.8 | 486.5 | 537.3 | 518.9 |
| 1991 | 494.4 | 530.5 | 556.7 | 600.8 | 679.2 | 733.8 | 771.0 | 813.6 | 720.7 | 731.7 | 715.6 | 723.7 |
| 1992 | 658.4 | 665.9 | 717.6 | 656.6 | 653.1 | 677.1 | 707.5 | 670.5 | 631.8 | 631.7 | 617.3 | 639.6 |
| 1993 | 636.7 | 658.6 | W | W | W | W | W | W | W | 610.1 | 603.8 | 610.7 |
| 1994 | 568.1 | 562.5 | 556.7 | 539.1 | 552.4 | 571.8 | 551.6 | 541.8 | 525.2 | 538.0 | 539.2 | 571.0 |
| 1995 | 520.0 | 546.9 | 534.7 | 537.6 | 530.5 | 546.8 | 532.4 | 543.3 | 524.9 | 544.5 | 563.0 | 552.3 |
| 1996 | 509.5 | 525.7 | 506.3 | 488.7 | 450.0 | 487.5 | 496.5 | 477.2 | 468.1 | 437.5 | 436.3 | 422.3 |
| 1997 | 399.7 | 401.5 | 430.0 | 439.6 | 456.8 | 465.5 | 491.9 | 474.8 | 447.4 | 461.6 | 451.5 | 471.8 |
| 1998 | 457.4 | 470.1 | 484.8 | 439.6 | 430.6 | 460.1 | 459.3 | 460.3 | 458.5 | 474.7 | 473.1 | 490.4 |
| 1999 | 460.3 | 499.1 | 514.2 | 537.2 | 551.3 | 532.4 | 573.3 | 532.0 | 483.2 | 494.6 | 500.2 | 520.8 |
| 2000 | 442.2 | 458.5 | 414.2 | 421.7 | 418.0 | 388.1 | 386.2 | 410.5 | 392.5 | 405.6 | 425.2 | 420.9 |
| 2001 | 383.8 | 388.0 | 396.3 | 373.0 | 380.5 | 369.8 | 382.2 | 408.5 | 368.9 | 398.9 | 386.9 | 395.0 |
| 2002 | 361.7 | 377.1 | 365.0 | 372.9 | 381.2 | 388.1 | 393.4 | 400.9 | 386.8 | 385.0 | 379.1 | 386.7 |
| 2003 | 353.4 | 345.2 | 359.3 | 379.4 | 403.8 | 414.4 | 439.7 | 427.7 | 410.8 | 427.8 | 423.0 | 414.6 |
| 2004 | 372.1 | 382.3 | 400.1 | 376.4 | 365.8 | 387.1 | 381.9 | 379.4 | 378.4 | 348.8 | 364.7 | 378.8 |
| 2005 | 411.1 | 444.9 | 437.9 | 444.2 | 488.1 | 551.7 | 507.2 | 493.1 | 443.1 | 426.1 | 422.2 | 417.6 |
| 2006 | 378.1 | 362.8 | 412.6 | 424.0 | 341.2 | 282.8 | 287.6 | 411.9 | 333.2 | 306.2 | 293.0 | 344.1 |
| 2007 | 287.9 | 506.5 | 337.0 | 367.1 | 383.1 | 410.2 | 403.9 | 437.6 | 419.9 | 447.0 | 473.8 | 453.8 |
| 2008 | 574.4 | 581.1 | 595.5 | 629.1 | 693.5 | 689.4 | 656.9 | 601.5 | 529.0 | 516.4 | 412.6 | 429.5 |
| 2009 | 409.8 | 402.8 | 443.2 | 488.6 | 502.6 | 500.9 | 492.2 | 486.8 | 472.8 | 518.4 | 510.6 | 513.5 |
| 2010 | 538.6 | 531.6 | 554.4 | 610.9 | 585.9 | 585.7 | 575.6 | 581.6 | 527.8 | 546.6 | 551.2 | 539.2 |
| 2011 | 459.4 | 448.9 | 494.8 | 542.4 | 543.6 | 539.0 | 578.9 | 576.1 | 506.2 | 481.4 | 494.8 | 549.0 |
| 2012 | 522.8 | 510.9 | 580.5 | 552.2 | 637.1 | 567.3 | 502.4 | 529.5 | 458.9 | 505.8 | 518.4 | 492.4 |
| 2013 | 494.9 | 435.1 | 448.5 | 493.1 | 475.2 | 549.0 | 625.0 | 555.0 | 363.7 | 162.1 | 162.3 | 159.3 |
| 2014 | 149.2 | 154.9 | 155.1 | 153.7 | 171.7 | 131.3 | 134.0 | 132.2 | 127.1 | 125.8 | 126.8 | 128.5 |
| 2015 | 114.0 | 109.0 | 111.9 | 117.3 | 120.6 | 130.8 | 136.2 | 133.8 | 121.2 | 131.4 | 128.6 | 130.7 |
| 2016 | 122.3 | 120.2 | 135.8 | 132.0 | 129.7 | 135.4 | 136.7 | 136.4 | 122.6 | 122.8 | 122.4 | 128.0 |
| 2017 | 108.1 | 117.2 | 121.8 | 127.6 | 133.8 | 138.3 | 133.0 | 140.8 | 124.0 | 125.2 | 122.9 | 128.0 |
| 2018 | 116.2 | 118.6 | 123.2 | 124.4 | 128.2 | 127.4 | 123.4 | 128.5 | 119.9 | 123.7 | 116.7 | 114.4 |
| 2019 | 102.3 | 104.6 | 105.4 | 113.4 | 116.9 | 117.7 | 117.2 | 116.4 | 114.1 | 116.4 | 116.8 | 114.2 |
| 2020 | 108.1 | 108.2 | 95.9 | 73.0 | 102.1 | 117.4 | 120.9 | 118.4 | 117.3 | 120.0 | 111.3 | 113.3 |
| 2021 | 102.9 | 101.2 | 115.5 | 122.8 | 125.9 | 131.4 | 130.2 | 130.2 | 127.9 | 122.7 | 122.1 | 120.2 |
| 2022 | 108.0 | 99.7 | 102.2 | |||||||||
| - = No Data Reported; -- = Not Applicable; NA = Not Available; W = Withheld to avoid disclosure of individual company data. |
| Release Date: 5/19/2022 |
| Next Release Date: TBD |