|
Download Data (XLS File) |
|
||||||||
|
||||||||
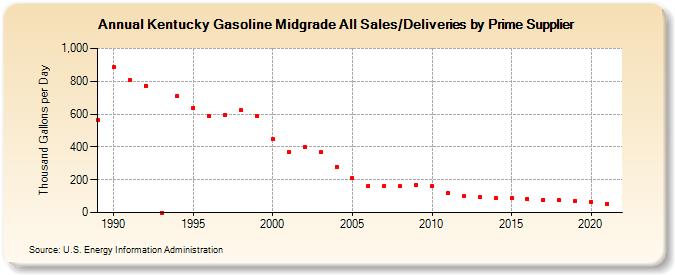
| Kentucky Gasoline Midgrade All Sales/Deliveries by Prime Supplier (Thousand Gallons per Day) | ||||||||
| Decade | Year-0 | Year-1 | Year-2 | Year-3 | Year-4 | Year-5 | Year-6 | Year-7 | Year-8 | Year-9 |
|---|---|---|---|---|---|---|---|---|---|---|
| 1980's | 562.3 | |||||||||
| 1990's | 884.1 | 807.2 | 773.9 | 0.0 | 707.8 | 639.3 | 587.8 | 596.6 | 622.2 | 587.6 |
| 2000's | 445.2 | 370.0 | 397.2 | 367.1 | 280.2 | 211.7 | 164.7 | 162.1 | 159.7 | 169.1 |
| 2010's | 162.5 | 117.8 | 98.4 | 92.5 | 85.9 | 87.8 | 83.7 | 78.8 | 74.4 | 71.4 |
| 2020's | 65.6 |
| - = No Data Reported; -- = Not Applicable; NA = Not Available; W = Withheld to avoid disclosure of individual company data. |
| Release Date: 6/1/2022 |
| Next Release Date: TBD |