|
Download Data (XLS File) |
|
||||||||
|
||||||||
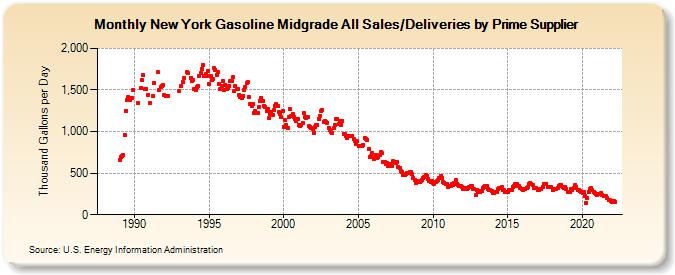
| New York Gasoline Midgrade All Sales/Deliveries by Prime Supplier (Thousand Gallons per Day) | ||||||||
| Year | Jan | Feb | Mar | Apr | May | Jun | Jul | Aug | Sep | Oct | Nov | Dec |
|---|---|---|---|---|---|---|---|---|---|---|---|---|
| 1988 | NA | NA | NA | NA | NA | NA | NA | NA | NA | NA | NA | NA |
| 1989 | 657.6 | 695.0 | 700.6 | 717.4 | 963.8 | 1,249.7 | 1,374.0 | 1,414.9 | 1,374.5 | 1,406.6 | 1,402.6 | 1,500.6 |
| 1990 | W | W | W | 1,344.7 | W | 1,520.6 | 1,617.6 | 1,676.6 | 1,511.4 | 1,514.9 | W | 1,442.5 |
| 1991 | 1,346.9 | W | W | 1,427.2 | 1,581.1 | W | W | 1,711.4 | 1,498.9 | 1,538.2 | 1,547.8 | 1,559.2 |
| 1992 | 1,433.9 | 1,426.6 | 1,426.4 | 1,428.6 | W | W | W | W | W | W | W | W |
| 1993 | 1,482.5 | 1,543.3 | W | 1,590.9 | 1,649.9 | W | 1,713.3 | 1,703.5 | W | 1,649.0 | 1,607.4 | 1,620.1 |
| 1994 | 1,511.2 | 1,500.4 | 1,535.5 | 1,550.5 | 1,668.7 | 1,698.1 | 1,755.0 | 1,803.2 | 1,662.6 | 1,692.0 | 1,670.7 | 1,732.6 |
| 1995 | 1,571.9 | 1,667.8 | 1,623.3 | 1,627.2 | 1,759.8 | 1,742.5 | 1,686.0 | 1,711.0 | 1,567.0 | 1,515.7 | 1,542.9 | 1,608.4 |
| 1996 | 1,499.6 | 1,561.4 | 1,511.6 | 1,520.2 | 1,548.9 | 1,604.8 | 1,605.4 | 1,650.2 | 1,483.5 | 1,542.8 | 1,511.7 | 1,508.9 |
| 1997 | 1,440.4 | 1,416.6 | 1,401.6 | 1,426.5 | 1,500.5 | 1,540.5 | 1,578.0 | 1,591.6 | 1,420.2 | 1,332.0 | 1,312.6 | 1,333.5 |
| 1998 | 1,225.7 | 1,249.0 | 1,226.7 | 1,223.9 | 1,299.3 | 1,362.5 | 1,409.3 | 1,364.1 | 1,310.7 | 1,291.1 | 1,252.3 | 1,274.8 |
| 1999 | 1,157.0 | 1,211.6 | 1,236.9 | 1,201.2 | 1,257.9 | 1,307.6 | 1,327.6 | 1,304.6 | 1,233.1 | 1,212.9 | 1,177.6 | 1,247.9 |
| 2000 | 1,055.6 | 1,133.8 | 1,079.9 | 1,043.8 | 1,169.9 | 1,268.2 | 1,190.5 | 1,213.8 | 1,174.9 | 1,153.0 | 1,122.7 | 1,149.9 |
| 2001 | 1,073.9 | 1,071.5 | 1,080.4 | 1,106.8 | 1,223.2 | 1,175.3 | 1,159.5 | 1,171.5 | 1,062.8 | 1,053.2 | 1,042.7 | 1,033.7 |
| 2002 | 987.2 | 1,060.1 | 1,084.2 | 1,084.5 | 1,154.3 | 1,190.7 | 1,243.4 | 1,259.4 | 1,115.0 | 1,124.5 | 1,117.7 | 1,106.4 |
| 2003 | 1,043.9 | 1,012.9 | 992.4 | 978.2 | 1,038.0 | 1,077.4 | 1,147.4 | 1,156.4 | 1,095.6 | 1,129.9 | 1,081.4 | 1,128.7 |
| 2004 | 976.5 | 967.6 | 943.5 | 928.0 | 943.3 | 949.1 | 947.6 | 948.7 | 904.9 | 886.2 | 855.3 | 886.0 |
| 2005 | 821.5 | 829.6 | 820.3 | 824.4 | 843.2 | 921.9 | 915.0 | 896.3 | 792.6 | 696.9 | 703.0 | 747.8 |
| 2006 | 666.1 | 693.8 | 717.3 | 683.7 | 689.6 | 713.9 | 758.7 | 736.4 | 629.5 | 628.4 | 613.5 | 625.0 |
| 2007 | 587.2 | 613.5 | 605.5 | 584.7 | 641.5 | 639.8 | 627.5 | 632.3 | 578.9 | 559.4 | 529.3 | 514.9 |
| 2008 | 479.2 | 479.5 | 487.8 | 498.1 | 499.0 | 509.9 | 516.4 | 483.9 | 445.6 | 417.0 | 387.3 | 401.1 |
| 2009 | 395.7 | 397.6 | 399.9 | 414.5 | 442.9 | 454.2 | 476.4 | 471.4 | 427.9 | 401.3 | 395.1 | 406.3 |
| 2010 | 379.2 | 366.4 | 392.6 | 404.2 | 416.5 | 438.3 | 468.9 | 443.9 | 393.4 | 383.7 | 369.3 | 372.7 |
| 2011 | 335.7 | 340.9 | 340.8 | 364.5 | 352.3 | 385.1 | 412.4 | 374.0 | 354.5 | 344.0 | 342.4 | 335.6 |
| 2012 | 306.1 | 318.3 | 318.9 | 309.2 | 318.3 | 336.7 | 347.3 | 348.6 | 315.2 | 304.7 | 235.1 | 295.7 |
| 2013 | 272.6 | 286.6 | 275.3 | 281.2 | 316.5 | 335.4 | 344.9 | 341.3 | 311.5 | 300.9 | 291.2 | 283.1 |
| 2014 | 260.3 | 261.5 | 274.5 | 276.6 | 303.4 | 321.6 | 320.6 | 330.8 | 300.2 | 293.6 | 271.8 | 268.8 |
| 2015 | 276.9 | 291.8 | 291.8 | 298.7 | 338.5 | 346.5 | 370.6 | 372.5 | 348.0 | 342.3 | 322.6 | 315.0 |
| 2016 | 297.5 | 309.5 | 312.3 | 322.6 | 338.5 | 372.7 | 379.5 | 370.3 | 353.4 | 324.8 | 323.8 | 324.2 |
| 2017 | 291.6 | 295.3 | 308.5 | 312.8 | 338.1 | 365.3 | 372.3 | 373.0 | 339.1 | 335.5 | 328.3 | 327.3 |
| 2018 | 303.1 | 309.0 | 305.3 | 308.7 | 325.6 | 350.7 | 360.2 | 362.3 | 330.1 | 321.9 | 329.3 | 308.2 |
| 2019 | 267.6 | 272.6 | 278.6 | 313.1 | 301.0 | 316.3 | 352.6 | 338.0 | 302.0 | 294.9 | 289.5 | 278.3 |
| 2020 | 266.8 | 272.5 | 220.7 | 142.1 | 198.8 | 272.8 | 311.5 | 316.7 | 293.3 | 276.3 | 257.9 | 249.4 |
| 2021 | 241.5 | 244.6 | 254.4 | 266.8 | 240.9 | 219.3 | 227.2 | 220.2 | 200.8 | 182.5 | 172.3 | 163.4 |
| 2022 | 152.7 | 167.6 | 153.6 | |||||||||
| - = No Data Reported; -- = Not Applicable; NA = Not Available; W = Withheld to avoid disclosure of individual company data. |
| Release Date: 5/19/2022 |
| Next Release Date: TBD |