|
Download Data (XLS File) |
|
||||||||
|
||||||||
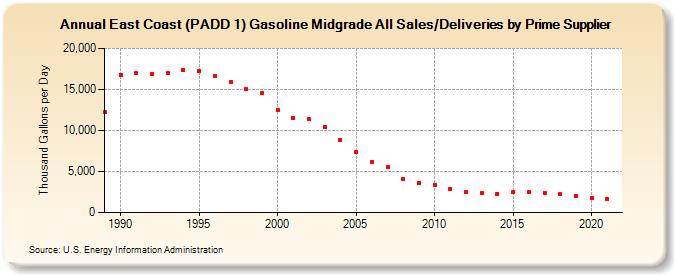
| East Coast (PADD 1) Gasoline Midgrade All Sales/Deliveries by Prime Supplier (Thousand Gallons per Day) | ||||||||
| Decade | Year-0 | Year-1 | Year-2 | Year-3 | Year-4 | Year-5 | Year-6 | Year-7 | Year-8 | Year-9 |
|---|---|---|---|---|---|---|---|---|---|---|
| 1980's | 12,196.3 | |||||||||
| 1990's | 16,794.9 | 16,944.5 | 16,934.7 | 17,018.9 | 17,415.3 | 17,274.0 | 16,654.5 | 15,908.8 | 15,040.0 | 14,578.7 |
| 2000's | 12,533.9 | 11,546.2 | 11,351.4 | 10,424.7 | 8,899.1 | 7,368.2 | 6,169.9 | 5,570.4 | 4,089.0 | 3,647.0 |
| 2010's | 3,348.2 | 2,870.6 | 2,548.9 | 2,429.9 | 2,319.7 | 2,506.8 | 2,513.8 | 2,429.3 | 2,221.2 | 2,048.1 |
| 2020's | 1,817.9 |
| - = No Data Reported; -- = Not Applicable; NA = Not Available; W = Withheld to avoid disclosure of individual company data. |
| Release Date: 6/1/2022 |
| Next Release Date: TBD |