|
Download Data (XLS File) |
|
||||||||
|
||||||||
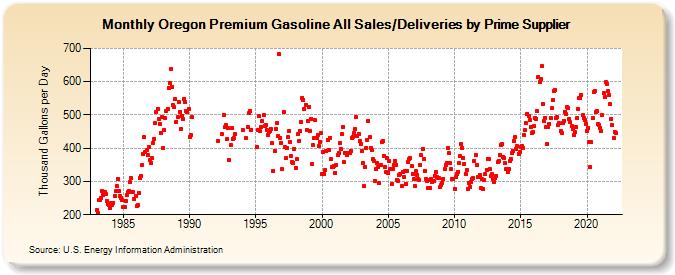
| Oregon Premium Gasoline All Sales/Deliveries by Prime Supplier (Thousand Gallons per Day) | ||||||||
| Year | Jan | Feb | Mar | Apr | May | Jun | Jul | Aug | Sep | Oct | Nov | Dec |
|---|---|---|---|---|---|---|---|---|---|---|---|---|
| 1983 | 213.6 | 205.2 | 243.6 | 244.9 | 250.9 | 270.8 | 259.6 | 268.2 | 263.3 | 241.6 | 231.4 | 228.3 |
| 1984 | 219.6 | 236.6 | 230.5 | 236.5 | 256.1 | 270.1 | 286.6 | 308.4 | 269.9 | 257.7 | 250.5 | 244.2 |
| 1985 | 223.2 | 223.2 | 242.6 | 259.5 | 267.0 | 270.0 | 297.2 | 310.4 | 269.4 | 267.3 | 246.4 | 255.4 |
| 1986 | 226.1 | 227.9 | 266.1 | 310.2 | 316.4 | 349.3 | 383.2 | 433.5 | 388.1 | 394.0 | 379.4 | 404.6 |
| 1987 | 364.4 | 355.5 | 369.4 | 416.3 | 429.0 | 474.7 | 508.5 | 519.2 | 486.8 | 473.6 | 446.8 | 492.9 |
| 1988 | 400.5 | 455.4 | 489.5 | 513.2 | 518.8 | 581.8 | 595.2 | 636.9 | 584.6 | 530.1 | 522.4 | 547.9 |
| 1989 | 480.1 | 493.6 | 538.9 | 509.8 | 458.2 | 497.7 | 486.7 | 549.3 | 538.6 | 511.3 | 508.1 | 519.0 |
| 1990 | 433.1 | 440.1 | 493.9 | W | W | W | W | W | W | W | W | W |
| 1991 | W | W | W | W | W | W | W | W | W | W | W | W |
| 1992 | W | W | 421.7 | W | W | 443.3 | W | 501.2 | 462.7 | 469.1 | 428.3 | 460.6 |
| 1993 | 363.0 | 409.1 | 460.5 | 428.4 | 432.1 | 441.2 | W | W | W | W | W | W |
| 1994 | 455.4 | W | W | 429.2 | W | 464.8 | 506.5 | 511.1 | 455.7 | W | W | W |
| 1995 | W | 403.2 | 455.9 | 496.6 | 451.5 | 463.2 | 480.5 | 499.4 | 467.1 | 470.1 | 455.4 | 440.6 |
| 1996 | 449.9 | 451.2 | 457.4 | 414.5 | 332.6 | 392.4 | 458.4 | 474.8 | 436.0 | 681.8 | 431.6 | 416.0 |
| 1997 | 336.0 | 508.6 | 404.1 | 370.0 | 400.2 | 432.2 | 451.2 | 419.0 | 375.2 | 359.4 | 356.9 | 398.8 |
| 1998 | 340.3 | 366.6 | 441.3 | 420.5 | 450.4 | 479.3 | 552.1 | 544.9 | 518.5 | 531.0 | 454.2 | 481.2 |
| 1999 | 524.9 | 453.1 | 488.6 | 351.8 | 409.5 | 431.5 | 483.3 | 431.7 | 439.9 | 406.5 | 419.1 | 444.2 |
| 2000 | 323.3 | 389.3 | 323.5 | 334.1 | 390.8 | 425.8 | 394.5 | 432.0 | 366.3 | 343.4 | 344.4 | 347.8 |
| 2001 | 325.5 | 348.8 | 379.1 | 384.3 | 416.0 | 396.2 | 442.9 | 464.8 | 358.3 | 385.6 | 384.6 | 379.6 |
| 2002 | 384.3 | 385.9 | 391.4 | 431.2 | 434.6 | 445.4 | 457.6 | 493.1 | 437.5 | 441.8 | 420.9 | 413.6 |
| 2003 | 393.0 | 354.9 | 285.3 | 343.3 | 401.1 | 425.4 | 481.9 | 432.8 | 401.4 | 394.4 | 366.1 | 361.1 |
| 2004 | 302.2 | 338.2 | 356.0 | 344.7 | 294.8 | 350.1 | 417.1 | 421.7 | 377.1 | 344.5 | 328.9 | 370.8 |
| 2005 | 325.5 | 360.7 | 337.5 | 292.5 | 338.4 | 350.9 | 362.3 | 350.6 | 305.6 | 302.8 | 318.6 | 323.7 |
| 2006 | 286.1 | 327.9 | 314.8 | 330.7 | 293.0 | 331.4 | 359.6 | 366.7 | 369.8 | 346.3 | 323.5 | 308.1 |
| 2007 | 286.2 | 330.1 | 319.4 | 307.6 | 304.4 | 350.1 | 378.2 | 398.3 | 367.1 | 332.1 | 308.8 | 301.9 |
| 2008 | 279.4 | 303.1 | 281.1 | 307.1 | 299.1 | 300.0 | 317.4 | 329.0 | 314.2 | 310.4 | 308.9 | 284.4 |
| 2009 | 290.6 | 296.5 | 308.3 | 337.1 | 349.8 | 356.6 | 401.9 | 384.3 | 354.6 | 336.9 | 308.8 | 307.4 |
| 2010 | 278.4 | 314.6 | 321.6 | 329.2 | 356.1 | 377.2 | 412.0 | 400.9 | 371.6 | 351.8 | 322.6 | 333.7 |
| 2011 | 278.2 | 296.5 | 284.6 | 298.6 | 306.4 | 309.7 | 361.5 | 380.4 | 348.5 | 313.3 | 313.8 | 318.4 |
| 2012 | 279.2 | 307.3 | 276.8 | 305.0 | 321.2 | 335.3 | 368.9 | 368.5 | 336.3 | 316.2 | 321.5 | 307.9 |
| 2013 | 299.5 | 310.7 | 317.7 | 357.5 | 360.0 | 379.4 | 408.9 | 413.6 | 373.6 | 371.0 | 356.2 | 337.6 |
| 2014 | 328.7 | 338.5 | 360.0 | 367.6 | 384.8 | 392.8 | 420.5 | 432.2 | 397.2 | 405.4 | 383.4 | 389.7 |
| 2015 | 403.4 | 406.8 | 399.1 | 438.9 | 453.3 | 474.3 | 503.6 | 497.9 | 484.3 | 463.7 | 446.5 | 449.0 |
| 2016 | 465.9 | 491.0 | 488.8 | 512.0 | 613.6 | 597.6 | 606.9 | 646.2 | 534.3 | 481.2 | 492.2 | 463.9 |
| 2017 | 413.7 | 464.5 | 473.8 | 491.3 | 520.0 | 543.6 | 570.6 | 574.7 | 491.9 | 492.4 | 469.8 | 474.7 |
| 2018 | 450.3 | 446.8 | 474.4 | 482.8 | 509.7 | 502.1 | 524.2 | 520.0 | 487.9 | 477.3 | 467.3 | 457.5 |
| 2019 | 438.3 | 447.8 | 463.1 | 490.5 | 518.5 | 550.3 | 550.4 | 560.8 | 499.7 | 491.0 | 484.6 | 473.9 |
| 2020 | 450.5 | 461.1 | 418.3 | 343.3 | 417.4 | 490.8 | 569.6 | 571.2 | 507.8 | 511.0 | 471.4 | 469.9 |
| 2021 | 461.1 | 451.2 | 498.9 | 565.1 | 552.5 | 598.0 | 593.0 | 570.7 | 559.7 | 531.7 | 487.7 | 469.2 |
| 2022 | 429.9 | 448.1 | 445.7 | |||||||||
| - = No Data Reported; -- = Not Applicable; NA = Not Available; W = Withheld to avoid disclosure of individual company data. |
| Release Date: 5/19/2022 |
| Next Release Date: TBD |