|
Download Data (XLS File) |
|
||||||||
|
||||||||
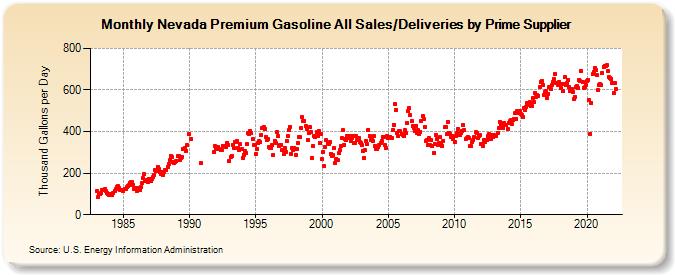
| Nevada Premium Gasoline All Sales/Deliveries by Prime Supplier (Thousand Gallons per Day) | ||||||||
| Year | Jan | Feb | Mar | Apr | May | Jun | Jul | Aug | Sep | Oct | Nov | Dec |
|---|---|---|---|---|---|---|---|---|---|---|---|---|
| 1983 | 113.6 | 85.1 | 97.5 | 101.3 | 106.7 | 118.2 | 121.0 | 121.4 | 112.9 | 104.3 | 98.1 | 96.7 |
| 1984 | 101.2 | 99.5 | 94.7 | 105.7 | 113.7 | 123.0 | 133.5 | 137.3 | 126.6 | 120.9 | 121.0 | 120.1 |
| 1985 | 116.1 | 122.8 | 125.2 | 132.6 | 139.7 | 142.3 | 154.4 | 156.8 | 155.3 | 144.9 | 125.2 | 127.9 |
| 1986 | 115.8 | 116.8 | 126.5 | 118.9 | 133.6 | 152.2 | 176.3 | 194.4 | 162.9 | 166.3 | 155.9 | 172.8 |
| 1987 | 163.2 | 163.2 | 173.2 | 182.5 | 192.8 | 215.0 | 210.2 | 231.5 | 217.7 | 206.0 | 195.2 | 205.6 |
| 1988 | 192.8 | 204.9 | 213.7 | 213.6 | 229.7 | 245.9 | 261.0 | 284.2 | 277.3 | 253.4 | 247.9 | 253.3 |
| 1989 | 258.5 | 280.7 | 284.0 | 261.7 | 275.0 | 276.7 | 315.7 | 314.8 | 321.8 | 306.7 | 334.3 | 386.5 |
| 1990 | W | 364.5 | W | W | W | W | W | W | W | W | 246.7 | W |
| 1991 | W | W | W | W | W | W | W | W | W | W | 300.5 | 329.1 |
| 1992 | 318.5 | 314.8 | 324.2 | 315.0 | 310.7 | 312.8 | 330.8 | 330.8 | 328.9 | 323.4 | 346.7 | 335.5 |
| 1993 | 257.5 | 277.2 | 283.7 | 337.6 | 322.2 | 349.4 | 351.1 | 354.8 | 321.2 | 313.4 | 338.9 | 313.9 |
| 1994 | 273.2 | 288.5 | 306.1 | 298.9 | 338.9 | 395.2 | 390.4 | 403.6 | 391.1 | 361.8 | 333.5 | 334.4 |
| 1995 | 293.3 | 315.7 | 346.4 | 354.2 | 347.5 | 382.4 | 415.0 | 422.9 | 412.1 | 374.8 | 360.3 | 362.3 |
| 1996 | 326.2 | 321.5 | 319.9 | 335.4 | 288.4 | 356.1 | 347.2 | 397.1 | 377.3 | 331.8 | 333.9 | 336.5 |
| 1997 | 309.2 | 291.9 | 322.8 | 303.6 | 355.8 | 377.3 | 406.7 | 424.2 | 293.7 | 322.6 | 310.2 | 320.9 |
| 1998 | 286.2 | 314.1 | 345.3 | 373.1 | 372.5 | 417.9 | 469.3 | 450.3 | 451.2 | 425.5 | 414.1 | 359.0 |
| 1999 | 393.3 | 421.2 | 396.0 | 273.8 | 330.8 | 379.4 | 372.4 | 396.5 | 379.1 | 400.8 | 345.3 | 388.6 |
| 2000 | 267.1 | 302.6 | 232.2 | 326.1 | 359.1 | 346.6 | 342.3 | 350.4 | 292.5 | 284.0 | 286.3 | 318.5 |
| 2001 | 248.6 | 268.3 | 261.5 | 295.6 | 310.3 | 330.1 | 367.8 | 405.4 | 337.3 | 364.4 | 359.3 | 380.5 |
| 2002 | 369.0 | 376.8 | 354.6 | 368.2 | 378.8 | 343.3 | 346.7 | 378.9 | 359.3 | 367.9 | 347.5 | 343.8 |
| 2003 | 333.9 | 307.0 | 273.1 | 309.5 | 355.4 | 338.8 | 409.2 | 380.2 | 360.3 | 374.1 | 356.5 | 379.9 |
| 2004 | 332.5 | 317.3 | 317.9 | 325.2 | 334.5 | 345.8 | 355.3 | 375.4 | 375.4 | 334.9 | 320.8 | 378.1 |
| 2005 | 370.3 | 376.1 | 374.7 | 367.9 | 405.2 | 433.7 | 530.3 | 505.6 | 390.8 | 377.1 | 403.6 | 401.2 |
| 2006 | 385.9 | 382.5 | 376.5 | 405.8 | 394.6 | 443.4 | 497.2 | 511.0 | 477.6 | 449.0 | 425.0 | 417.4 |
| 2007 | 401.5 | 427.6 | 394.3 | 406.9 | 390.5 | 399.4 | 451.1 | 473.1 | 458.6 | 423.8 | 354.6 | 360.2 |
| 2008 | 334.8 | 368.1 | 333.7 | 360.4 | 329.1 | 297.9 | 338.2 | 385.0 | 361.9 | 335.6 | 347.3 | 372.9 |
| 2009 | 341.6 | 332.5 | 356.3 | 420.4 | 420.8 | 385.9 | 447.4 | 394.6 | 389.1 | 372.5 | 380.3 | 363.5 |
| 2010 | 351.4 | 377.8 | 390.7 | 412.3 | 382.7 | 381.1 | 393.8 | 400.6 | 431.0 | 407.8 | 365.0 | 367.6 |
| 2011 | 375.4 | 367.5 | 329.1 | 329.0 | 351.9 | 358.9 | 375.4 | 396.1 | 393.9 | 369.6 | 380.9 | 382.9 |
| 2012 | 340.5 | 342.2 | 330.8 | 361.2 | 349.7 | 361.0 | 377.0 | 389.9 | 363.5 | 365.2 | 383.6 | 373.2 |
| 2013 | 381.9 | 380.1 | 381.0 | 393.0 | 416.1 | 447.9 | 429.4 | 430.9 | 416.9 | 442.6 | 432.6 | 429.4 |
| 2014 | 412.9 | 442.9 | 450.0 | 453.3 | 435.1 | 455.6 | 459.5 | 488.2 | 462.6 | 497.6 | 487.3 | 497.9 |
| 2015 | 485.4 | 479.6 | 472.0 | 514.5 | 501.5 | 516.4 | 536.8 | 525.5 | 541.6 | 524.9 | 525.1 | 563.3 |
| 2016 | 541.2 | 586.7 | 564.3 | 575.1 | 572.3 | 613.5 | 638.4 | 645.0 | 621.6 | 578.1 | 589.3 | 596.6 |
| 2017 | 563.1 | 581.0 | 614.8 | 603.0 | 622.3 | 637.8 | 653.4 | 674.7 | 633.9 | 634.3 | 625.5 | 639.4 |
| 2018 | 609.7 | 627.5 | 593.0 | 626.7 | 661.8 | 623.5 | 631.9 | 645.8 | 613.7 | 594.9 | 606.4 | 590.4 |
| 2019 | 557.5 | 568.5 | 613.8 | 620.2 | 608.8 | 649.9 | 640.8 | 690.3 | 636.3 | 608.3 | 612.1 | 624.8 |
| 2020 | 644.3 | 648.0 | 550.5 | 390.2 | 537.9 | 674.9 | 686.1 | 707.0 | 697.3 | 669.7 | 600.7 | 625.3 |
| 2021 | 627.4 | 622.4 | 681.4 | 712.1 | 717.7 | 713.8 | 718.5 | 693.4 | 661.9 | 658.0 | 653.6 | 631.4 |
| 2022 | 586.4 | 634.9 | 603.6 | |||||||||
| - = No Data Reported; -- = Not Applicable; NA = Not Available; W = Withheld to avoid disclosure of individual company data. |
| Release Date: 5/19/2022 |
| Next Release Date: TBD |