|
Download Data (XLS File) |
|
||||||||
|
||||||||
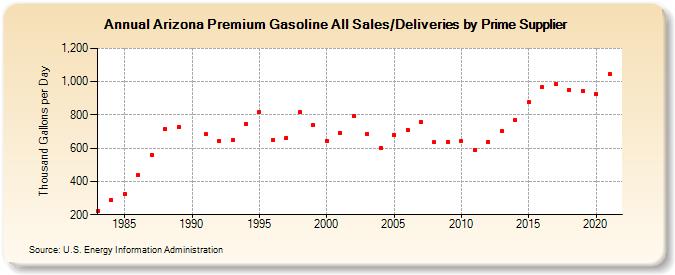
| Arizona Premium Gasoline All Sales/Deliveries by Prime Supplier (Thousand Gallons per Day) | ||||||||
| Decade | Year-0 | Year-1 | Year-2 | Year-3 | Year-4 | Year-5 | Year-6 | Year-7 | Year-8 | Year-9 |
|---|---|---|---|---|---|---|---|---|---|---|
| 1980's | 222.6 | 289.8 | 324.8 | 440.2 | 559.9 | 714.0 | 727.5 | |||
| 1990's | W | 682.3 | 644.6 | 648.3 | 747.6 | 817.2 | 649.4 | 663.4 | 815.8 | 736.4 |
| 2000's | 645.5 | 693.8 | 795.0 | 686.9 | 602.1 | 678.9 | 711.5 | 756.6 | 634.3 | 640.0 |
| 2010's | 640.7 | 591.5 | 639.3 | 704.6 | 770.8 | 875.7 | 965.2 | 984.0 | 952.7 | 946.5 |
| 2020's | 925.6 |
| - = No Data Reported; -- = Not Applicable; NA = Not Available; W = Withheld to avoid disclosure of individual company data. |
| Release Date: 6/1/2022 |
| Next Release Date: TBD |