|
Download Data (XLS File) |
|
||||||||
|
||||||||
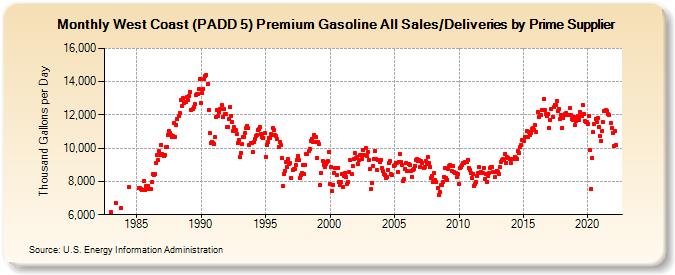
| West Coast (PADD 5) Premium Gasoline All Sales/Deliveries by Prime Supplier (Thousand Gallons per Day) | ||||||||
| Year | Jan | Feb | Mar | Apr | May | Jun | Jul | Aug | Sep | Oct | Nov | Dec |
|---|---|---|---|---|---|---|---|---|---|---|---|---|
| 1983 | 6,167.6 | W | W | W | W | 6,679.5 | W | W | W | 6,383.2 | W | W |
| 1984 | W | W | W | W | W | 7,679.0 | W | W | W | W | W | W |
| 1985 | W | W | 7,600.5 | 7,581.0 | 7,542.3 | 7,509.8 | W | 8,053.2 | 7,492.8 | 7,711.2 | 7,530.6 | 7,701.4 |
| 1986 | W | 7,547.3 | 7,958.7 | 8,444.8 | 8,412.6 | 8,426.8 | 9,107.5 | 9,593.0 | 9,289.0 | 9,811.7 | 9,613.5 | 10,207.6 |
| 1987 | 9,649.6 | 9,546.0 | 9,608.9 | 10,041.7 | 10,074.8 | 10,783.9 | 11,053.3 | 10,891.8 | 10,790.2 | 10,658.9 | 10,738.7 | 11,536.7 |
| 1988 | 10,690.2 | 11,401.3 | 11,735.0 | 11,925.0 | 12,106.8 | 12,887.2 | 12,529.3 | 13,001.9 | 12,719.5 | 12,757.0 | 12,750.5 | 13,075.4 |
| 1989 | 12,895.3 | 13,139.2 | 13,363.0 | 12,279.2 | 12,344.4 | 12,460.2 | 12,640.0 | 13,227.1 | 13,232.8 | 13,281.2 | 13,534.7 | 14,145.0 |
| 1990 | 12,724.6 | 13,294.1 | 13,565.1 | 14,146.0 | 14,314.9 | 14,416.8 | 13,834.0 | 12,321.5 | 10,938.8 | 10,288.3 | 10,400.7 | 10,308.2 |
| 1991 | 10,277.5 | 10,663.6 | 11,880.9 | 12,277.7 | 11,921.8 | 12,151.1 | 12,363.3 | 12,584.2 | 11,872.0 | 12,331.2 | 12,057.1 | 12,061.7 |
| 1992 | 11,283.3 | 11,270.0 | 11,775.4 | 12,477.6 | 11,951.4 | 11,559.8 | 11,020.0 | 11,243.8 | 11,109.9 | 10,878.8 | 10,301.6 | 10,487.6 |
| 1993 | 9,465.2 | 9,735.9 | 10,225.5 | 10,650.5 | 10,675.3 | 10,942.5 | 11,186.4 | 11,362.7 | 11,213.1 | 10,221.3 | 10,297.9 | 10,309.4 |
| 1994 | 9,782.2 | 10,363.5 | 10,550.1 | 10,716.5 | 10,772.2 | 11,108.9 | 11,143.3 | 11,246.7 | 10,860.0 | 10,668.5 | 10,641.5 | 10,905.6 |
| 1995 | 9,474.2 | 10,217.4 | 10,361.7 | 10,619.2 | 10,593.1 | 10,824.9 | 10,796.8 | 11,210.3 | 11,118.8 | 10,782.7 | 10,709.7 | 10,542.8 |
| 1996 | 10,048.6 | 10,400.8 | 10,177.6 | 9,381.9 | 7,729.9 | 8,444.3 | 8,657.5 | 9,151.8 | 8,887.0 | 9,320.5 | 9,057.4 | 9,121.4 |
| 1997 | 8,194.1 | 8,684.9 | 8,758.1 | 8,762.0 | 8,985.3 | 9,275.9 | 9,526.0 | 9,266.7 | 8,218.5 | 8,385.5 | 8,495.4 | 8,980.0 |
| 1998 | 8,420.1 | 8,969.0 | 9,640.9 | 9,623.5 | 9,802.4 | 9,977.1 | 10,448.4 | 10,561.6 | 10,397.6 | 10,770.1 | 10,357.5 | 10,662.7 |
| 1999 | 9,416.0 | 10,363.3 | 10,252.1 | 7,760.4 | 8,499.8 | 9,225.5 | 9,012.5 | 8,843.7 | 9,050.5 | 9,162.0 | 9,213.5 | 9,791.9 |
| 2000 | 7,850.2 | 8,857.6 | 7,429.4 | 7,810.8 | 8,527.0 | 8,822.2 | 8,375.3 | 8,828.1 | 7,970.4 | 7,790.3 | 7,941.1 | 8,424.5 |
| 2001 | 7,682.6 | 8,310.4 | 8,485.1 | 8,270.2 | 7,833.5 | 7,971.6 | 8,575.7 | 9,272.9 | 8,439.6 | 8,925.8 | 9,323.4 | 9,705.3 |
| 2002 | 9,389.5 | 9,459.9 | 9,076.1 | 9,283.7 | 9,562.3 | 9,582.2 | 9,366.8 | 9,874.6 | 9,565.8 | 10,003.9 | 9,546.0 | 9,759.3 |
| 2003 | 9,284.3 | 8,747.2 | 7,522.8 | 7,928.6 | 8,944.6 | 9,354.4 | 9,848.5 | 9,321.2 | 8,691.3 | 9,267.9 | 9,143.7 | 9,307.1 |
| 2004 | 8,793.6 | 8,619.7 | 8,448.4 | 8,409.2 | 8,201.6 | 8,292.9 | 8,703.7 | 9,081.6 | 9,211.3 | 8,429.5 | 8,374.4 | 8,958.9 |
| 2005 | 8,961.3 | 9,138.1 | 9,081.8 | 8,594.6 | 9,166.5 | 9,676.9 | 9,179.1 | 8,992.5 | 8,019.8 | 8,124.8 | 8,763.0 | 9,097.5 |
| 2006 | 8,624.9 | 9,033.5 | 9,001.7 | 8,624.9 | 8,294.6 | 8,705.3 | 8,764.6 | 8,948.4 | 9,277.6 | 9,328.9 | 9,203.2 | 9,267.9 |
| 2007 | 8,890.1 | 9,199.8 | 9,106.9 | 8,796.4 | 8,854.5 | 9,255.6 | 9,044.3 | 9,469.6 | 9,120.3 | 8,854.0 | 8,199.8 | 8,351.9 |
| 2008 | 7,968.6 | 8,513.1 | 8,098.9 | 7,955.3 | 7,602.1 | 7,168.1 | 7,360.9 | 7,760.9 | 7,815.8 | 7,983.5 | 8,288.9 | 8,819.2 |
| 2009 | 8,217.3 | 8,108.3 | 8,754.0 | 8,908.0 | 8,974.0 | 8,637.6 | 8,938.1 | 8,582.8 | 8,532.1 | 8,483.7 | 8,254.9 | 8,425.3 |
| 2010 | 7,866.7 | 8,792.9 | 8,861.2 | 8,964.1 | 9,118.2 | 9,094.7 | 9,147.8 | 9,177.6 | 9,312.4 | 8,825.9 | 8,698.1 | 8,495.2 |
| 2011 | 8,194.3 | 8,459.4 | 7,742.6 | 7,825.0 | 7,950.3 | 8,301.9 | 8,480.1 | 8,866.6 | 8,583.6 | 8,517.4 | 8,500.7 | 8,834.5 |
| 2012 | 8,125.9 | 8,432.8 | 7,996.5 | 8,339.8 | 8,512.2 | 8,783.5 | 8,858.1 | 8,841.0 | 8,548.8 | 8,245.7 | 8,582.6 | 8,636.5 |
| 2013 | 8,557.5 | 8,459.2 | 8,840.5 | 9,177.7 | 9,284.0 | 9,364.5 | 9,309.8 | 9,658.8 | 9,129.5 | 9,450.0 | 9,424.4 | 9,320.0 |
| 2014 | 9,103.5 | 9,360.0 | 9,353.2 | 9,332.8 | 9,494.9 | 9,412.1 | 9,352.5 | 9,819.6 | 9,724.3 | 10,091.9 | 10,196.6 | 10,499.3 |
| 2015 | 10,435.4 | 10,674.3 | 10,670.0 | 11,039.4 | 10,650.2 | 10,988.4 | 10,794.1 | 10,883.2 | 11,173.0 | 11,224.2 | 11,109.6 | 11,366.4 |
| 2016 | 10,943.1 | 12,185.9 | 11,889.6 | 11,986.0 | 11,996.3 | 12,312.8 | 12,292.6 | 12,928.0 | 12,296.2 | 12,053.0 | 11,962.1 | 12,073.6 |
| 2017 | 11,209.9 | 11,682.8 | 12,364.0 | 11,884.7 | 12,446.7 | 12,573.4 | 12,602.3 | 12,853.8 | 12,216.4 | 12,372.1 | 11,769.3 | 11,971.1 |
| 2018 | 11,243.6 | 11,835.1 | 11,978.6 | 12,028.6 | 12,131.8 | 12,023.8 | 11,987.6 | 12,395.5 | 12,001.1 | 11,734.5 | 11,704.5 | 11,883.5 |
| 2019 | 11,372.4 | 11,654.5 | 11,823.4 | 11,934.7 | 11,718.4 | 12,173.0 | 11,946.1 | 12,596.5 | 12,081.7 | 11,637.0 | 11,565.8 | 11,568.4 |
| 2020 | 11,448.4 | 11,921.1 | 9,869.3 | 7,548.3 | 9,428.9 | 10,971.8 | 11,424.6 | 11,780.2 | 11,559.9 | 11,804.5 | 11,303.0 | 10,718.3 |
| 2021 | 10,432.8 | 11,011.9 | 11,555.8 | 12,244.0 | 12,223.1 | 12,274.4 | 12,254.0 | 12,045.1 | 11,990.5 | 11,516.6 | 11,234.1 | 10,932.1 |
| 2022 | 10,118.5 | 11,032.8 | 10,218.9 | |||||||||
| - = No Data Reported; -- = Not Applicable; NA = Not Available; W = Withheld to avoid disclosure of individual company data. |
| Release Date: 5/19/2022 |
| Next Release Date: TBD |