|
Download Data (XLS File) |
|
||||||||
|
||||||||
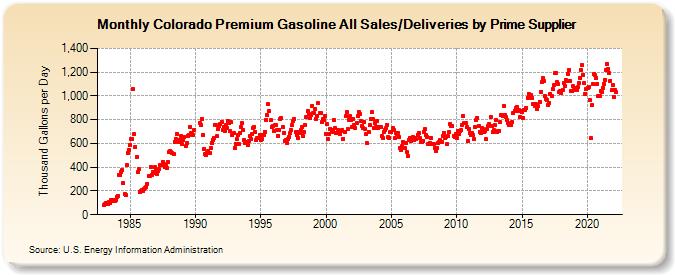
| Colorado Premium Gasoline All Sales/Deliveries by Prime Supplier (Thousand Gallons per Day) | ||||||||
| Year | Jan | Feb | Mar | Apr | May | Jun | Jul | Aug | Sep | Oct | Nov | Dec |
|---|---|---|---|---|---|---|---|---|---|---|---|---|
| 1983 | 77.7 | 92.2 | 96.4 | 87.5 | 92.3 | 109.9 | 101.8 | 124.0 | 122.0 | 113.7 | 114.3 | 122.3 |
| 1984 | 152.9 | 161.0 | 337.9 | 333.4 | 361.9 | 375.8 | 266.1 | 172.3 | 167.9 | 417.4 | 521.2 | 548.2 |
| 1985 | 586.8 | 635.9 | 638.1 | 1,057.1 | 676.0 | 568.8 | 486.1 | 361.0 | 381.0 | 195.4 | 195.7 | 211.9 |
| 1986 | 203.5 | 217.4 | 225.3 | 234.3 | 261.2 | 327.0 | 329.0 | 404.3 | 337.4 | 360.5 | 350.1 | 400.8 |
| 1987 | 374.5 | 345.3 | 367.4 | 384.3 | 418.9 | 421.0 | 447.6 | 428.6 | 399.8 | 417.4 | 391.1 | 442.0 |
| 1988 | 526.3 | 538.1 | 525.1 | 519.7 | 513.5 | 614.5 | 637.5 | 680.2 | 626.5 | 611.4 | 627.3 | 665.9 |
| 1989 | 592.6 | 627.1 | 653.3 | 576.2 | 600.3 | 666.3 | 671.0 | 740.7 | 689.2 | 688.3 | 673.1 | 716.3 |
| 1990 | W | W | W | W | 772.1 | 753.0 | 809.6 | 670.5 | 555.5 | 507.8 | 500.7 | 520.0 |
| 1991 | 537.8 | 515.6 | 560.6 | 607.6 | 629.7 | 647.0 | 757.9 | 751.0 | 660.1 | 720.3 | 744.4 | 760.8 |
| 1992 | 781.4 | 716.9 | 740.0 | 703.9 | 751.0 | 730.2 | 787.3 | 770.0 | 701.7 | 776.5 | 673.5 | 685.5 |
| 1993 | 563.1 | 598.8 | 635.7 | 674.8 | 594.9 | 688.1 | 737.2 | 771.9 | 711.2 | 627.6 | 605.7 | 615.8 |
| 1994 | 584.6 | 621.2 | 662.9 | 638.9 | 677.5 | 733.5 | 740.5 | 700.2 | 625.0 | 643.3 | 642.2 | 673.8 |
| 1995 | 630.4 | 638.9 | 674.5 | 671.9 | 699.9 | 797.7 | 835.7 | 928.9 | 871.9 | 793.2 | 740.6 | 746.9 |
| 1996 | 705.5 | 754.2 | 751.6 | 710.0 | 666.6 | 716.2 | 804.1 | 813.2 | 740.9 | 688.6 | 620.7 | 629.9 |
| 1997 | 604.0 | 638.4 | 658.3 | 683.7 | 712.6 | 751.5 | 785.5 | 805.5 | 694.6 | 670.3 | 649.2 | 700.3 |
| 1998 | 691.5 | 709.7 | 737.5 | 662.2 | 695.8 | 752.9 | 826.1 | 871.5 | 845.7 | 812.2 | 836.5 | 916.5 |
| 1999 | 853.8 | 857.5 | 890.8 | 809.2 | 830.9 | 936.7 | 855.9 | 858.4 | 776.2 | 803.1 | 798.2 | 834.5 |
| 2000 | 683.5 | 759.9 | 633.7 | 679.4 | 721.5 | 697.5 | 710.5 | 799.3 | 729.2 | 685.7 | 684.9 | 713.9 |
| 2001 | 685.1 | 680.7 | 707.6 | 711.7 | 640.7 | 697.3 | 827.3 | 862.1 | 718.7 | 801.2 | 830.6 | 797.2 |
| 2002 | 741.1 | 805.1 | 755.7 | 731.2 | 774.9 | 829.1 | 867.4 | 849.7 | 787.8 | 748.0 | 727.2 | 780.5 |
| 2003 | 718.1 | 679.7 | 599.5 | 699.2 | 754.2 | 802.2 | 861.7 | 803.2 | 729.1 | 774.0 | 742.5 | 792.7 |
| 2004 | 728.8 | 737.9 | 741.1 | 659.3 | 646.5 | 699.3 | 714.4 | 726.3 | 758.0 | 651.8 | 648.6 | 696.5 |
| 2005 | 696.9 | 727.7 | 715.7 | 644.4 | 685.7 | 676.1 | 689.0 | 654.4 | 563.4 | 545.1 | 580.3 | 610.4 |
| 2006 | 559.2 | 604.9 | 526.7 | 496.6 | 629.2 | 647.5 | 623.4 | 630.1 | 650.3 | 627.9 | 647.3 | 633.3 |
| 2007 | 674.5 | 687.0 | 649.0 | 610.9 | 610.1 | 623.4 | 697.8 | 721.3 | 670.2 | 654.4 | 592.7 | 602.6 |
| 2008 | 649.6 | 593.1 | 595.1 | 595.2 | 563.4 | 539.1 | 561.2 | 600.1 | 608.1 | 625.5 | 611.4 | 659.9 |
| 2009 | 691.2 | 643.8 | 655.3 | 595.1 | 661.7 | 696.9 | 759.5 | 749.2 | 745.0 | 665.0 | 658.0 | 680.5 |
| 2010 | 646.4 | 703.5 | 683.1 | 705.6 | 713.0 | 758.5 | 829.8 | 772.0 | 773.1 | 737.3 | 621.9 | 724.9 |
| 2011 | 689.4 | 667.1 | 687.1 | 671.5 | 636.6 | 742.3 | 793.9 | 818.0 | 745.4 | 699.8 | 690.7 | 729.3 |
| 2012 | 718.7 | 698.3 | 701.8 | 633.2 | 718.3 | 750.8 | 766.5 | 821.8 | 750.7 | 696.5 | 711.7 | 756.9 |
| 2013 | 795.7 | 698.5 | 707.2 | 708.4 | 777.7 | 842.2 | 831.9 | 915.2 | 843.0 | 822.5 | 798.5 | 775.0 |
| 2014 | 757.4 | 760.0 | 752.1 | 777.3 | 853.9 | 872.2 | 894.5 | 908.3 | 871.5 | 877.4 | 823.9 | 872.8 |
| 2015 | 864.9 | 817.6 | 884.1 | 879.8 | 901.4 | 984.7 | 1,019.3 | 994.3 | 1,009.5 | 981.0 | 933.9 | 935.1 |
| 2016 | 918.4 | 928.1 | 886.9 | 912.2 | 952.0 | 1,031.1 | 1,118.6 | 1,151.0 | 1,125.5 | 997.2 | 973.9 | 967.2 |
| 2017 | 920.4 | 942.1 | 1,017.5 | 999.0 | 1,059.3 | 1,089.6 | 1,190.1 | 1,195.9 | 1,113.8 | 1,103.3 | 1,036.7 | 1,044.2 |
| 2018 | 1,021.5 | 1,053.1 | 1,112.3 | 1,081.2 | 1,136.7 | 1,124.8 | 1,187.6 | 1,218.2 | 1,123.0 | 1,038.5 | 1,045.5 | 1,083.1 |
| 2019 | 1,045.8 | 1,064.6 | 1,051.2 | 1,072.6 | 1,105.7 | 1,152.6 | 1,221.1 | 1,261.8 | 1,178.5 | 1,104.9 | 1,020.0 | 1,059.1 |
| 2020 | 1,064.6 | 1,077.6 | 964.2 | 642.7 | 921.3 | 1,096.6 | 1,186.0 | 1,171.9 | 1,153.8 | 1,103.0 | 1,000.2 | 999.5 |
| 2021 | 1,038.7 | 1,035.7 | 1,065.3 | 1,101.2 | 1,138.1 | 1,221.4 | 1,271.5 | 1,230.2 | 1,193.1 | 1,129.7 | 1,046.9 | 1,088.5 |
| 2022 | 994.5 | 1,051.3 | 1,035.5 | |||||||||
| - = No Data Reported; -- = Not Applicable; NA = Not Available; W = Withheld to avoid disclosure of individual company data. |
| Release Date: 5/19/2022 |
| Next Release Date: TBD |