|
Download Data (XLS File) |
|
||||||||
|
||||||||
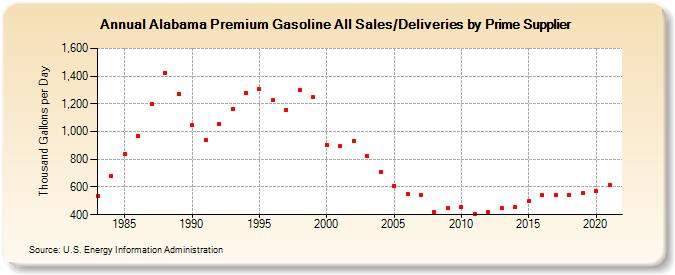
| Alabama Premium Gasoline All Sales/Deliveries by Prime Supplier (Thousand Gallons per Day) | ||||||||
| Decade | Year-0 | Year-1 | Year-2 | Year-3 | Year-4 | Year-5 | Year-6 | Year-7 | Year-8 | Year-9 |
|---|---|---|---|---|---|---|---|---|---|---|
| 1980's | 536.3 | 682.0 | 837.9 | 969.4 | 1,195.5 | 1,425.3 | 1,271.0 | |||
| 1990's | 1,046.7 | 940.8 | 1,057.1 | 1,161.8 | 1,280.4 | 1,304.3 | 1,224.9 | 1,157.7 | 1,301.6 | 1,247.3 |
| 2000's | 905.3 | 898.8 | 933.6 | 822.9 | 708.1 | 608.6 | 551.0 | 544.3 | 423.1 | 446.1 |
| 2010's | 453.8 | 405.2 | 417.7 | 445.9 | 452.3 | 498.6 | 541.7 | 542.4 | 540.6 | 554.8 |
| 2020's | 570.3 |
| - = No Data Reported; -- = Not Applicable; NA = Not Available; W = Withheld to avoid disclosure of individual company data. |
| Release Date: 6/1/2022 |
| Next Release Date: TBD |