|
Download Data (XLS File) |
|
||||||||
|
||||||||
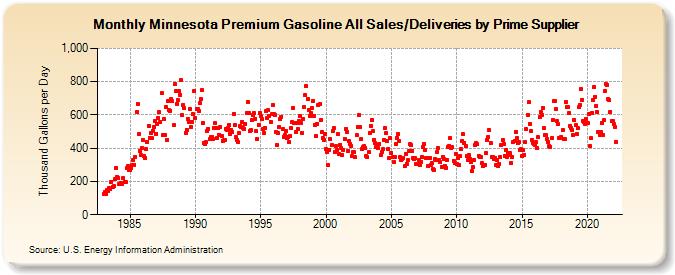
| Minnesota Premium Gasoline All Sales/Deliveries by Prime Supplier (Thousand Gallons per Day) | ||||||||
| Year | Jan | Feb | Mar | Apr | May | Jun | Jul | Aug | Sep | Oct | Nov | Dec |
|---|---|---|---|---|---|---|---|---|---|---|---|---|
| 1983 | 125.1 | 136.9 | 124.7 | 148.5 | 143.0 | 162.4 | 154.5 | 199.5 | 168.4 | 172.5 | 212.6 | 281.4 |
| 1984 | 229.5 | 222.6 | 186.1 | 183.5 | 190.7 | 186.0 | 218.0 | 199.3 | 194.1 | 277.9 | 291.7 | 271.5 |
| 1985 | 269.3 | 277.9 | 297.6 | 330.8 | 300.9 | 347.1 | 616.4 | 667.5 | 482.9 | 384.5 | 358.2 | 399.6 |
| 1986 | 450.0 | 350.8 | 342.4 | 392.2 | 439.9 | 534.9 | 464.2 | 490.3 | 459.8 | 505.4 | 528.6 | 565.3 |
| 1987 | 487.6 | 546.9 | 580.6 | 614.6 | 558.8 | 729.3 | 479.9 | 575.7 | 479.7 | 648.6 | 451.8 | 682.1 |
| 1988 | 628.1 | 625.1 | 694.8 | 681.9 | 537.2 | 786.3 | 742.2 | 667.3 | 689.2 | 741.6 | 721.1 | 809.4 |
| 1989 | 598.4 | 660.4 | 642.0 | 493.7 | 511.4 | 577.5 | 560.0 | 636.5 | 530.3 | 559.8 | 603.2 | 745.4 |
| 1990 | 580.1 | 633.3 | 635.6 | 626.2 | 669.5 | 694.3 | 750.3 | 551.4 | 433.6 | 424.5 | 434.6 | 501.5 |
| 1991 | 517.3 | 453.0 | 467.2 | 467.7 | 457.9 | 521.7 | 549.4 | 523.3 | 462.8 | 519.0 | 480.6 | 529.4 |
| 1992 | 471.2 | 446.2 | 447.4 | 448.7 | 516.9 | 510.0 | 522.6 | 539.5 | 486.0 | 510.2 | 500.2 | 606.8 |
| 1993 | 538.4 | 466.2 | 449.8 | 434.8 | 490.0 | 531.3 | 525.5 | 556.8 | 520.5 | 515.1 | 543.9 | 612.0 |
| 1994 | 678.5 | 612.7 | 504.8 | 506.7 | 567.4 | 598.3 | 610.6 | 575.6 | 501.5 | 457.9 | 540.4 | 613.7 |
| 1995 | 591.0 | 573.4 | 516.1 | 493.5 | 523.7 | 622.9 | 579.8 | 626.6 | 590.8 | 560.2 | 603.7 | 661.7 |
| 1996 | 605.8 | 600.0 | 499.5 | 420.1 | 492.5 | 529.8 | 576.4 | 590.5 | 512.9 | 469.7 | 476.8 | 504.7 |
| 1997 | 461.6 | 464.5 | 434.2 | 470.9 | 520.9 | 555.0 | 643.8 | 552.9 | 498.0 | 554.2 | 513.9 | 563.1 |
| 1998 | 591.1 | 551.4 | 492.9 | 577.5 | 645.6 | 717.4 | 774.9 | 694.4 | 630.6 | 594.7 | 611.0 | 642.8 |
| 1999 | 685.3 | 595.6 | 539.9 | 472.6 | 548.2 | 658.2 | 663.7 | 572.0 | 495.5 | 463.0 | 450.2 | 486.7 |
| 2000 | 394.5 | 377.3 | 296.0 | 391.0 | 453.7 | 417.3 | 502.6 | 520.7 | 377.9 | 412.6 | 386.3 | 483.8 |
| 2001 | 366.9 | 421.5 | 398.3 | 359.7 | 389.0 | 456.5 | 516.9 | 499.8 | 385.7 | 445.5 | 428.0 | 414.9 |
| 2002 | 350.4 | 376.0 | 374.6 | 344.9 | 476.7 | 529.6 | 600.5 | 525.0 | 453.1 | 393.2 | 404.5 | 412.1 |
| 2003 | 399.5 | 350.4 | 345.7 | 378.8 | 490.6 | 535.9 | 571.4 | 501.0 | 450.0 | 431.9 | 408.0 | 410.2 |
| 2004 | 402.2 | 425.8 | 356.3 | 374.4 | 392.1 | 451.3 | 520.3 | 492.1 | 444.6 | 395.9 | 343.3 | 459.2 |
| 2005 | 372.4 | 345.6 | 317.2 | 348.6 | 426.0 | 464.1 | 484.0 | 442.3 | 347.2 | 327.4 | 333.7 | 341.7 |
| 2006 | 292.5 | 366.0 | 306.9 | 327.0 | 381.4 | 423.5 | 417.4 | 383.3 | 341.3 | 332.8 | 338.4 | 304.9 |
| 2007 | 302.5 | 330.0 | 300.1 | 318.0 | 345.7 | 406.9 | 424.6 | 389.3 | 340.7 | 339.3 | 290.9 | 339.2 |
| 2008 | 300.7 | 313.3 | 274.4 | 271.1 | 336.3 | 326.7 | 378.3 | 398.7 | 329.9 | 314.1 | 289.6 | 347.1 |
| 2009 | 335.5 | 295.3 | 281.8 | 331.3 | 409.3 | 413.5 | 459.4 | 401.9 | 404.2 | 325.6 | 308.0 | 366.2 |
| 2010 | 306.2 | 338.8 | 298.5 | 352.4 | 394.5 | 443.4 | 483.7 | 434.1 | 410.5 | 351.7 | 327.1 | 358.1 |
| 2011 | 335.6 | 316.4 | 262.0 | 286.7 | 330.4 | 421.0 | 430.9 | 422.7 | 354.2 | 344.0 | 344.0 | 308.4 |
| 2012 | 289.9 | 300.1 | 300.4 | 369.8 | 446.4 | 467.9 | 507.6 | 429.0 | 348.9 | 347.4 | 336.4 | 343.2 |
| 2013 | 296.9 | 327.1 | 294.3 | 305.9 | 346.8 | 417.9 | 449.7 | 422.4 | 354.2 | 386.9 | 346.7 | 373.4 |
| 2014 | 356.7 | 368.9 | 308.6 | 349.5 | 434.9 | 445.9 | 500.2 | 460.1 | 428.4 | 439.0 | 390.0 | 392.2 |
| 2015 | 351.5 | 387.4 | 361.7 | 434.3 | 512.7 | 598.5 | 674.9 | 545.8 | 504.2 | 450.3 | 431.1 | 424.4 |
| 2016 | 420.4 | 434.2 | 400.5 | 464.8 | 586.2 | 615.4 | 601.1 | 643.1 | 521.7 | 479.3 | 476.8 | 455.1 |
| 2017 | 435.9 | 413.8 | 409.4 | 458.4 | 569.9 | 680.8 | 682.7 | 637.0 | 564.2 | 543.3 | 460.0 | 461.9 |
| 2018 | 468.5 | 509.3 | 454.9 | 452.3 | 678.7 | 645.9 | 647.7 | 612.9 | 535.8 | 521.6 | 508.2 | 479.3 |
| 2019 | 566.7 | 536.9 | 486.7 | 521.6 | 644.9 | 662.3 | 755.4 | 691.5 | 564.8 | 555.2 | 544.6 | 573.8 |
| 2020 | 551.5 | 605.1 | 412.4 | 458.8 | 611.7 | 688.5 | 765.8 | 709.4 | 655.5 | 617.4 | 498.2 | 480.8 |
| 2021 | 496.6 | 551.3 | 479.5 | 567.6 | 745.3 | 783.0 | 782.3 | 698.7 | 688.4 | 619.7 | 563.2 | 562.9 |
| 2022 | 546.6 | 530.1 | 440.1 | |||||||||
| - = No Data Reported; -- = Not Applicable; NA = Not Available; W = Withheld to avoid disclosure of individual company data. |
| Release Date: 5/19/2022 |
| Next Release Date: TBD |