|
Download Data (XLS File) |
|
||||||||
|
||||||||
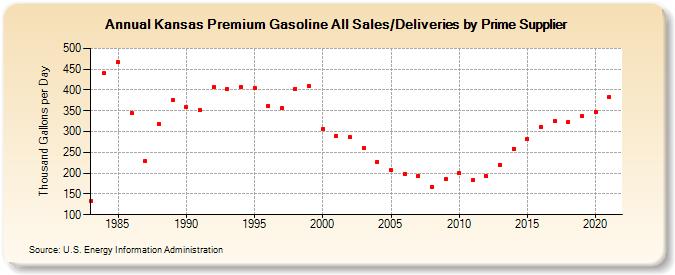
| Kansas Premium Gasoline All Sales/Deliveries by Prime Supplier (Thousand Gallons per Day) | ||||||||
| Decade | Year-0 | Year-1 | Year-2 | Year-3 | Year-4 | Year-5 | Year-6 | Year-7 | Year-8 | Year-9 |
|---|---|---|---|---|---|---|---|---|---|---|
| 1980's | 133.0 | 440.0 | 466.2 | 344.8 | 228.9 | 317.9 | 375.3 | |||
| 1990's | 359.6 | 351.5 | 407.4 | 401.4 | 407.8 | 405.4 | 361.0 | 356.4 | 403.1 | 408.4 |
| 2000's | 305.3 | 290.2 | 286.4 | 260.4 | 227.8 | 206.8 | 198.7 | 193.7 | 166.8 | 186.0 |
| 2010's | 199.6 | 182.4 | 192.5 | 220.7 | 259.0 | 281.5 | 311.6 | 325.0 | 323.2 | 336.8 |
| 2020's | 347.9 |
| - = No Data Reported; -- = Not Applicable; NA = Not Available; W = Withheld to avoid disclosure of individual company data. |
| Release Date: 6/1/2022 |
| Next Release Date: TBD |