|
Download Data (XLS File) |
|
||||||||
|
||||||||
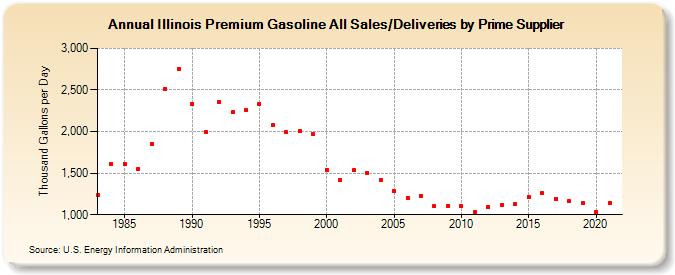
| Illinois Premium Gasoline All Sales/Deliveries by Prime Supplier (Thousand Gallons per Day) | ||||||||
| Decade | Year-0 | Year-1 | Year-2 | Year-3 | Year-4 | Year-5 | Year-6 | Year-7 | Year-8 | Year-9 |
|---|---|---|---|---|---|---|---|---|---|---|
| 1980's | 1,231.6 | 1,612.8 | 1,612.4 | 1,546.0 | 1,851.3 | 2,517.2 | 2,755.9 | |||
| 1990's | 2,329.6 | 1,993.1 | 2,350.7 | 2,230.0 | 2,262.0 | 2,337.1 | 2,073.3 | 1,992.8 | 2,006.9 | 1,968.3 |
| 2000's | 1,542.4 | 1,421.4 | 1,536.8 | 1,503.3 | 1,412.9 | 1,279.3 | 1,206.1 | 1,226.0 | 1,100.2 | 1,110.0 |
| 2010's | 1,100.5 | 1,035.0 | 1,090.3 | 1,117.9 | 1,124.7 | 1,213.5 | 1,256.5 | 1,192.4 | 1,160.8 | 1,137.2 |
| 2020's | 1,036.6 |
| - = No Data Reported; -- = Not Applicable; NA = Not Available; W = Withheld to avoid disclosure of individual company data. |
| Release Date: 6/1/2022 |
| Next Release Date: TBD |