|
Download Data (XLS File) |
|
||||||||
|
||||||||
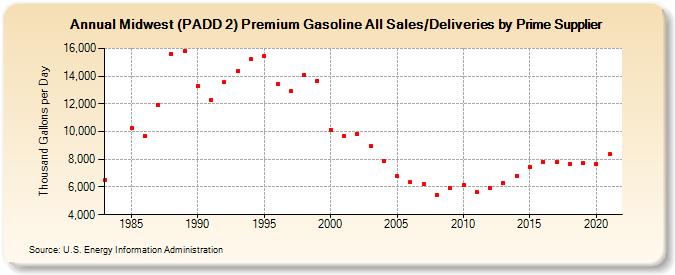
| Midwest (PADD 2) Premium Gasoline All Sales/Deliveries by Prime Supplier (Thousand Gallons per Day) | ||||||||
| Decade | Year-0 | Year-1 | Year-2 | Year-3 | Year-4 | Year-5 | Year-6 | Year-7 | Year-8 | Year-9 |
|---|---|---|---|---|---|---|---|---|---|---|
| 1980's | 6,486.2 | W | 10,221.3 | 9,696.4 | 11,940.9 | 15,604.0 | 15,823.3 | |||
| 1990's | 13,289.7 | 12,266.7 | 13,565.5 | 14,357.0 | 15,208.5 | 15,483.0 | 13,403.7 | 12,901.7 | 14,088.2 | 13,679.5 |
| 2000's | 10,146.8 | 9,683.9 | 9,831.2 | 8,954.4 | 7,898.5 | 6,764.0 | 6,337.0 | 6,217.2 | 5,431.1 | 5,892.8 |
| 2010's | 6,134.5 | 5,609.7 | 5,912.8 | 6,276.8 | 6,788.5 | 7,463.5 | 7,808.0 | 7,813.1 | 7,659.6 | 7,735.8 |
| 2020's | 7,654.2 |
| - = No Data Reported; -- = Not Applicable; NA = Not Available; W = Withheld to avoid disclosure of individual company data. |
| Release Date: 6/1/2022 |
| Next Release Date: TBD |