|
Download Data (XLS File) |
|
||||||||
|
||||||||
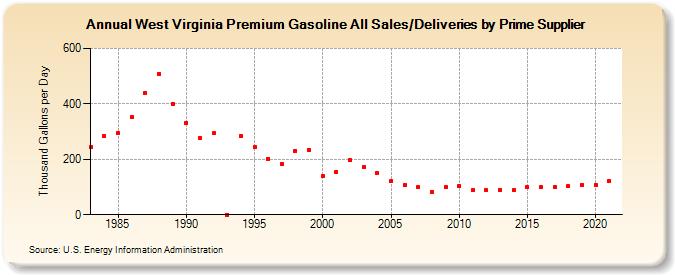
| West Virginia Premium Gasoline All Sales/Deliveries by Prime Supplier (Thousand Gallons per Day) | ||||||||
| Decade | Year-0 | Year-1 | Year-2 | Year-3 | Year-4 | Year-5 | Year-6 | Year-7 | Year-8 | Year-9 |
|---|---|---|---|---|---|---|---|---|---|---|
| 1980's | 242.8 | 283.0 | 295.6 | 351.2 | 439.6 | 508.8 | 400.5 | |||
| 1990's | 332.3 | 276.8 | 293.4 | 0.0 | 284.8 | 242.5 | 202.1 | 184.4 | 231.5 | 233.9 |
| 2000's | 139.7 | 154.4 | 198.1 | 172.8 | 149.4 | 121.6 | 107.8 | 99.5 | 82.3 | 99.5 |
| 2010's | 105.2 | 88.9 | 87.6 | 88.5 | 88.9 | 99.0 | 99.7 | 100.2 | 103.3 | 108.7 |
| 2020's | 108.3 |
| - = No Data Reported; -- = Not Applicable; NA = Not Available; W = Withheld to avoid disclosure of individual company data. |
| Release Date: 6/1/2022 |
| Next Release Date: TBD |