|
Download Data (XLS File) |
|
||||||||
|
||||||||
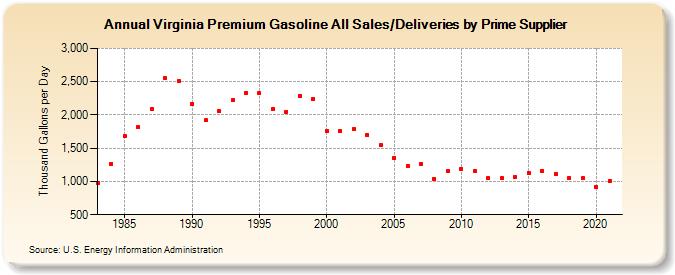
| Virginia Premium Gasoline All Sales/Deliveries by Prime Supplier (Thousand Gallons per Day) | ||||||||
| Decade | Year-0 | Year-1 | Year-2 | Year-3 | Year-4 | Year-5 | Year-6 | Year-7 | Year-8 | Year-9 |
|---|---|---|---|---|---|---|---|---|---|---|
| 1980's | 981.4 | 1,264.2 | 1,681.6 | 1,818.4 | 2,093.8 | 2,548.7 | 2,504.7 | |||
| 1990's | 2,170.1 | 1,918.8 | 2,052.1 | 2,220.3 | 2,331.6 | 2,325.7 | 2,084.1 | 2,050.0 | 2,291.2 | 2,246.0 |
| 2000's | 1,759.3 | 1,759.9 | 1,791.3 | 1,701.6 | 1,545.0 | 1,359.8 | 1,235.0 | 1,265.7 | 1,040.3 | 1,151.3 |
| 2010's | 1,193.7 | 1,164.3 | 1,049.5 | 1,046.7 | 1,069.1 | 1,132.7 | 1,162.6 | 1,116.5 | 1,055.2 | 1,044.4 |
| 2020's | 913.9 |
| - = No Data Reported; -- = Not Applicable; NA = Not Available; W = Withheld to avoid disclosure of individual company data. |
| Release Date: 6/1/2022 |
| Next Release Date: TBD |