|
Download Data (XLS File) |
|
||||||||
|
||||||||
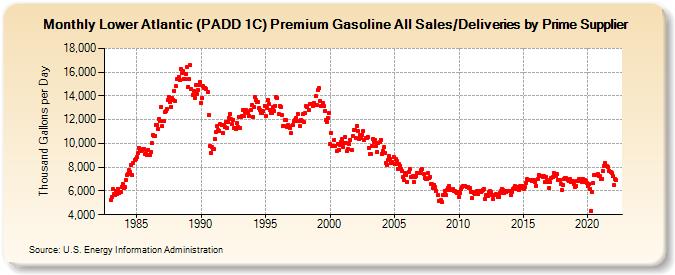
| Lower Atlantic (PADD 1C) Premium Gasoline All Sales/Deliveries by Prime Supplier (Thousand Gallons per Day) | ||||||||
| Year | Jan | Feb | Mar | Apr | May | Jun | Jul | Aug | Sep | Oct | Nov | Dec |
|---|---|---|---|---|---|---|---|---|---|---|---|---|
| 1983 | 5,276.1 | 5,449.9 | 6,130.7 | 5,716.3 | 5,691.3 | 5,990.0 | 5,756.0 | 6,201.9 | 5,825.4 | 5,871.9 | 6,371.1 | 6,612.8 |
| 1984 | 6,289.4 | 6,319.1 | 6,889.1 | 7,304.7 | 7,450.3 | 7,727.3 | 7,605.1 | 8,202.0 | 7,326.4 | 8,363.5 | 8,589.3 | 8,722.8 |
| 1985 | 8,824.9 | 9,160.5 | 9,625.7 | 9,465.9 | 9,400.5 | 9,419.2 | 9,518.5 | 9,555.6 | 9,092.2 | 9,197.3 | 8,985.7 | 9,448.2 |
| 1986 | 9,062.6 | 9,308.5 | 10,046.2 | 10,725.6 | 10,607.9 | 10,643.0 | 11,578.8 | 11,513.7 | 11,204.5 | 12,060.0 | 11,867.5 | 13,061.6 |
| 1987 | 11,437.8 | 11,855.5 | 12,609.4 | 12,733.2 | 12,933.1 | 13,666.1 | 13,910.7 | 13,509.5 | 13,101.2 | 13,802.3 | 13,679.0 | 14,428.1 |
| 1988 | 13,535.0 | 14,792.8 | 15,463.2 | 15,625.7 | 15,308.1 | 16,307.3 | 15,918.6 | 16,059.0 | 15,451.0 | 15,401.9 | 15,866.0 | 16,469.5 |
| 1989 | 14,781.8 | 15,444.0 | 16,562.5 | 14,584.1 | 14,109.7 | 14,445.0 | 13,834.5 | 14,892.2 | 14,129.1 | 14,532.2 | 14,937.1 | 15,152.3 |
| 1990 | 13,418.6 | 13,854.5 | 14,816.7 | 14,666.9 | 14,699.6 | 14,602.3 | 14,335.0 | 12,406.6 | 9,778.6 | 9,220.6 | 9,719.4 | 9,493.5 |
| 1991 | 9,520.3 | 10,337.1 | 10,940.5 | 11,463.3 | 11,107.5 | 11,043.4 | 11,609.2 | 11,593.3 | 10,896.4 | 11,585.5 | 11,414.5 | 11,833.9 |
| 1992 | 11,276.7 | 11,790.7 | 12,134.3 | 12,441.5 | 12,016.4 | 11,642.5 | 11,985.1 | 11,304.6 | 11,219.4 | 11,695.6 | 11,406.3 | 12,208.0 |
| 1993 | 11,284.7 | 12,254.1 | 12,328.7 | 12,798.6 | 12,276.3 | 12,608.3 | 12,807.4 | 12,688.2 | 12,555.5 | 12,272.7 | 12,839.5 | 13,255.6 |
| 1994 | 12,242.7 | 13,098.0 | 13,895.1 | 13,690.5 | 13,469.1 | 13,474.9 | 12,976.4 | 12,808.4 | 12,553.2 | 12,555.8 | 12,693.0 | 13,192.8 |
| 1995 | 12,274.3 | 13,000.3 | 13,669.1 | 13,343.6 | 12,855.6 | 12,596.8 | 12,531.9 | 13,031.1 | 12,764.8 | 13,183.3 | 13,899.8 | 13,811.8 |
| 1996 | 12,465.4 | 13,154.2 | 13,057.3 | 12,417.8 | 11,451.1 | 11,505.2 | 12,012.2 | 11,958.8 | 11,398.7 | 11,552.4 | 11,474.4 | 11,283.3 |
| 1997 | 10,851.2 | 11,567.8 | 11,849.3 | 11,953.7 | 12,112.7 | 11,920.4 | 12,499.6 | 11,913.7 | 11,474.9 | 11,997.1 | 11,924.9 | 12,442.3 |
| 1998 | 11,796.9 | 12,524.0 | 13,114.3 | 13,048.8 | 12,840.2 | 13,285.7 | 13,318.4 | 13,288.9 | 13,179.9 | 13,410.5 | 13,272.9 | 13,960.8 |
| 1999 | 13,208.3 | 14,464.0 | 14,634.1 | 13,542.3 | 13,127.9 | 13,420.8 | 13,124.3 | 12,719.3 | 12,008.1 | 11,807.5 | 12,134.0 | 12,570.9 |
| 2000 | 9,971.1 | 10,905.7 | 9,808.3 | 9,756.5 | 10,298.2 | 9,755.6 | 9,331.2 | 9,981.0 | 9,452.7 | 9,876.5 | 10,103.7 | 10,363.5 |
| 2001 | 9,719.6 | 10,071.4 | 10,558.1 | 9,999.6 | 9,403.7 | 9,504.7 | 9,959.3 | 10,299.4 | 9,450.5 | 10,608.2 | 11,142.6 | 11,120.5 |
| 2002 | 10,433.3 | 11,478.8 | 11,052.6 | 10,393.9 | 10,696.0 | 10,492.0 | 10,724.5 | 11,066.1 | 10,307.0 | 10,470.7 | 10,460.4 | 10,577.0 |
| 2003 | 9,645.7 | 9,108.5 | 9,121.5 | 9,777.2 | 10,395.9 | 10,145.2 | 10,277.9 | 9,792.7 | 9,292.5 | 10,003.1 | 10,087.6 | 10,314.7 |
| 2004 | 9,128.6 | 9,370.8 | 9,679.2 | 9,195.9 | 8,388.5 | 8,212.3 | 8,570.6 | 8,917.9 | 8,721.9 | 8,318.5 | 8,471.0 | 8,898.8 |
| 2005 | 8,276.4 | 8,719.3 | 8,485.1 | 7,861.4 | 8,284.6 | 8,118.3 | 7,860.4 | 7,652.8 | 7,192.1 | 6,920.0 | 7,546.0 | 7,377.8 |
| 2006 | 6,794.0 | 7,598.9 | 7,824.5 | 7,187.6 | 7,203.4 | 7,232.2 | 6,775.0 | 7,203.2 | 7,217.3 | 7,507.7 | 7,552.9 | 7,492.4 |
| 2007 | 7,487.7 | 7,730.2 | 7,816.1 | 7,425.8 | 7,128.5 | 6,989.0 | 7,001.6 | 7,477.3 | 7,073.4 | 7,207.8 | 6,567.5 | 6,547.2 |
| 2008 | 6,213.5 | 6,537.4 | 6,298.2 | 6,022.5 | 5,641.7 | 5,184.1 | 5,119.5 | 5,259.4 | 5,041.7 | 5,619.8 | 5,626.2 | 6,012.2 |
| 2009 | 5,636.6 | 6,062.1 | 6,232.2 | 6,399.2 | 6,086.6 | 6,092.9 | 6,166.5 | 5,993.4 | 5,995.0 | 5,953.7 | 5,835.1 | 5,890.7 |
| 2010 | 5,488.0 | 5,828.9 | 6,152.7 | 6,336.9 | 6,412.7 | 6,429.4 | 6,431.8 | 6,293.9 | 6,370.7 | 6,280.9 | 6,238.2 | 5,937.6 |
| 2011 | 5,395.3 | 5,929.5 | 5,800.4 | 5,764.9 | 5,723.3 | 5,968.2 | 5,747.6 | 6,003.5 | 5,904.3 | 5,968.5 | 6,107.8 | 6,196.7 |
| 2012 | 5,360.1 | 5,677.8 | 5,679.9 | 5,592.5 | 5,876.4 | 5,982.4 | 5,918.4 | 5,685.1 | 5,301.8 | 5,639.4 | 5,721.5 | 5,698.2 |
| 2013 | 5,482.4 | 5,516.1 | 5,809.4 | 6,023.1 | 6,182.0 | 6,045.7 | 5,807.0 | 5,996.4 | 5,912.2 | 6,019.2 | 6,005.9 | 5,990.1 |
| 2014 | 5,668.2 | 5,902.0 | 6,170.7 | 6,229.7 | 6,386.9 | 6,197.7 | 6,179.6 | 6,349.7 | 6,092.4 | 6,387.5 | 6,277.6 | 6,403.1 |
| 2015 | 6,204.8 | 6,362.5 | 6,670.9 | 6,994.9 | 6,959.2 | 6,931.8 | 6,955.2 | 6,930.4 | 6,871.6 | 6,846.4 | 6,896.4 | 6,758.2 |
| 2016 | 6,447.0 | 6,965.5 | 7,378.0 | 7,218.0 | 7,297.2 | 7,290.8 | 7,196.6 | 7,226.4 | 6,718.0 | 7,183.3 | 6,920.4 | 6,757.0 |
| 2017 | 6,254.1 | 6,720.4 | 7,099.9 | 7,175.9 | 7,517.5 | 7,242.3 | 7,241.0 | 7,416.1 | 6,911.9 | 6,921.9 | 6,896.2 | 6,551.6 |
| 2018 | 6,097.5 | 6,482.9 | 7,028.3 | 7,129.0 | 7,060.5 | 6,942.0 | 6,820.0 | 6,990.8 | 6,757.9 | 6,821.2 | 6,804.6 | 6,579.2 |
| 2019 | 6,370.2 | 6,456.4 | 6,797.9 | 6,864.0 | 7,046.0 | 6,818.6 | 6,748.3 | 7,040.3 | 6,780.8 | 6,889.8 | 6,844.8 | 6,690.0 |
| 2020 | 6,383.9 | 6,578.7 | 6,157.2 | 4,312.6 | 5,873.6 | 6,682.0 | 7,364.5 | 7,324.5 | 7,315.3 | 7,416.5 | 7,276.0 | 7,243.9 |
| 2021 | 6,964.2 | 7,031.0 | 7,647.8 | 8,093.0 | 8,394.1 | 8,120.5 | 8,063.9 | 7,979.4 | 7,717.0 | 7,613.9 | 7,511.5 | 7,226.1 |
| 2022 | 6,500.8 | 7,048.1 | 6,883.5 | |||||||||
| - = No Data Reported; -- = Not Applicable; NA = Not Available; W = Withheld to avoid disclosure of individual company data. |
| Release Date: 5/19/2022 |
| Next Release Date: TBD |