|
Download Data (XLS File) |
|
||||||||
|
||||||||
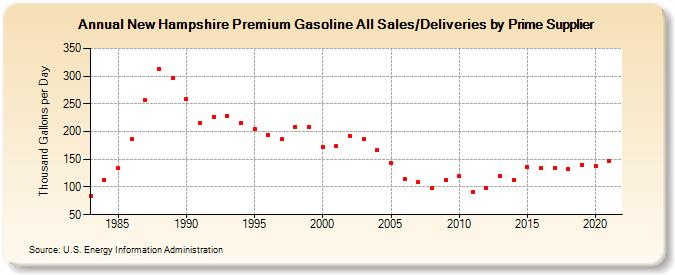
| New Hampshire Premium Gasoline All Sales/Deliveries by Prime Supplier (Thousand Gallons per Day) | ||||||||
| Decade | Year-0 | Year-1 | Year-2 | Year-3 | Year-4 | Year-5 | Year-6 | Year-7 | Year-8 | Year-9 |
|---|---|---|---|---|---|---|---|---|---|---|
| 1980's | 84.3 | 113.1 | 135.1 | 186.4 | 256.7 | 312.4 | 296.6 | |||
| 1990's | 258.8 | 215.7 | 226.7 | 228.7 | 216.2 | 205.1 | 194.6 | 186.3 | 209.1 | 208.1 |
| 2000's | 171.5 | 173.9 | 192.6 | 187.2 | 165.9 | 143.2 | 114.4 | 108.5 | 97.7 | 112.6 |
| 2010's | 119.2 | 91.2 | 98.8 | 119.9 | 112.7 | 136.8 | 133.9 | 134.4 | 132.2 | 140.4 |
| 2020's | 138.5 |
| - = No Data Reported; -- = Not Applicable; NA = Not Available; W = Withheld to avoid disclosure of individual company data. |
| Release Date: 6/1/2022 |
| Next Release Date: TBD |