|
Download Data (XLS File) |
|
||||||||
|
||||||||
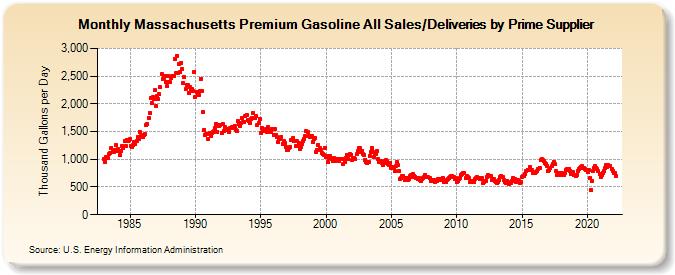
| Massachusetts Premium Gasoline All Sales/Deliveries by Prime Supplier (Thousand Gallons per Day) | ||||||||
| Year | Jan | Feb | Mar | Apr | May | Jun | Jul | Aug | Sep | Oct | Nov | Dec |
|---|---|---|---|---|---|---|---|---|---|---|---|---|
| 1983 | 1,008.9 | 959.6 | 1,036.9 | 1,019.7 | 1,021.9 | 1,090.7 | 1,119.2 | 1,210.3 | 1,145.5 | 1,136.8 | 1,173.1 | 1,257.7 |
| 1984 | 1,157.4 | 1,185.3 | 1,157.5 | 1,077.1 | 1,153.9 | 1,243.8 | 1,195.1 | 1,326.0 | 1,241.2 | 1,351.0 | 1,326.7 | 1,345.6 |
| 1985 | 1,359.0 | 1,247.9 | 1,220.1 | 1,258.1 | 1,312.4 | 1,277.8 | 1,328.9 | 1,398.2 | 1,370.9 | 1,495.9 | 1,425.8 | 1,445.2 |
| 1986 | 1,396.8 | 1,434.3 | 1,448.3 | 1,611.4 | 1,632.2 | 1,740.9 | 1,839.7 | 2,102.6 | 2,018.6 | 2,120.1 | 2,090.8 | 2,243.9 |
| 1987 | 1,955.8 | 2,136.3 | 2,086.5 | 2,171.0 | 2,297.7 | 2,537.6 | 2,451.5 | 2,462.4 | 2,493.8 | 2,386.9 | 2,320.4 | 2,499.1 |
| 1988 | 2,395.3 | 2,384.8 | 2,461.3 | 2,493.2 | 2,496.5 | 2,813.3 | 2,556.0 | 2,867.5 | 2,558.4 | 2,721.3 | 2,568.3 | 2,742.9 |
| 1989 | 2,629.4 | 2,368.0 | 2,475.0 | 2,271.3 | 2,346.7 | 2,339.9 | 2,197.2 | 2,310.9 | 2,247.7 | 2,266.2 | 2,230.7 | 2,582.2 |
| 1990 | 2,128.7 | 2,212.3 | 2,183.3 | 2,156.3 | 2,230.7 | 2,454.7 | 2,233.3 | 1,844.8 | 1,523.5 | 1,440.2 | 1,457.0 | 1,456.0 |
| 1991 | 1,370.4 | 1,481.5 | 1,414.4 | 1,467.7 | 1,490.4 | 1,513.4 | 1,565.7 | 1,638.7 | 1,493.9 | 1,613.4 | 1,603.9 | 1,614.5 |
| 1992 | 1,481.6 | 1,642.2 | 1,505.8 | 1,574.6 | 1,544.9 | 1,530.1 | 1,542.6 | 1,498.6 | 1,557.7 | 1,556.6 | 1,587.3 | 1,562.1 |
| 1993 | 1,606.9 | 1,522.6 | 1,511.2 | 1,688.3 | 1,633.1 | 1,606.6 | 1,656.3 | 1,741.1 | 1,678.0 | 1,674.9 | 1,785.6 | 1,803.9 |
| 1994 | 1,702.2 | 1,688.4 | 1,660.6 | 1,720.4 | 1,736.8 | 1,837.0 | 1,742.4 | 1,742.3 | 1,776.1 | 1,625.6 | 1,652.4 | 1,727.7 |
| 1995 | 1,466.4 | 1,571.1 | 1,517.5 | 1,531.4 | 1,519.9 | 1,546.9 | 1,491.6 | 1,581.6 | 1,502.4 | 1,492.9 | 1,542.0 | 1,547.9 |
| 1996 | 1,430.4 | 1,543.7 | 1,445.6 | 1,404.1 | 1,305.7 | 1,365.2 | 1,374.1 | 1,410.5 | 1,278.2 | 1,329.4 | 1,290.2 | 1,219.3 |
| 1997 | 1,171.3 | 1,176.2 | 1,205.3 | 1,229.6 | 1,340.5 | 1,342.5 | 1,384.3 | 1,321.0 | 1,237.0 | 1,322.6 | 1,247.3 | 1,293.5 |
| 1998 | 1,178.9 | 1,224.2 | 1,266.5 | 1,321.5 | 1,370.2 | 1,412.3 | 1,504.3 | 1,491.1 | 1,420.0 | 1,408.0 | 1,417.5 | 1,425.1 |
| 1999 | 1,305.0 | 1,371.5 | 1,384.4 | 1,136.6 | 1,172.7 | 1,260.2 | 1,195.0 | 1,172.9 | 1,118.1 | 1,098.5 | 1,080.1 | 1,205.8 |
| 2000 | 1,040.6 | 1,063.0 | 954.5 | 1,014.1 | 1,058.1 | 1,012.6 | 968.5 | 1,027.7 | 974.6 | 990.5 | 1,006.2 | 987.1 |
| 2001 | 974.0 | 999.9 | 1,008.8 | 1,002.6 | 921.7 | 946.3 | 1,018.9 | 1,074.0 | 1,012.1 | 1,069.0 | 1,087.5 | 1,085.2 |
| 2002 | 987.1 | 1,029.1 | 1,026.1 | 1,004.4 | 1,087.5 | 1,142.9 | 1,203.3 | 1,206.0 | 1,125.1 | 1,154.6 | 1,089.8 | 1,081.5 |
| 2003 | 991.9 | 946.4 | 925.5 | 956.4 | 1,062.2 | 1,138.6 | 1,207.9 | 1,126.8 | 1,033.0 | 1,104.5 | 1,096.6 | 1,148.2 |
| 2004 | 1,000.7 | 947.3 | 961.3 | 933.0 | 892.0 | 931.4 | 976.0 | 989.7 | 960.8 | 911.3 | 905.0 | 932.1 |
| 2005 | 837.9 | 863.0 | 836.6 | 791.3 | 872.5 | 943.1 | 888.3 | 781.9 | 642.6 | 661.0 | 697.8 | 694.1 |
| 2006 | 619.2 | 664.7 | 659.8 | 629.3 | 644.3 | 691.8 | 708.2 | 679.4 | 732.5 | 706.5 | 677.0 | 661.9 |
| 2007 | 636.0 | 654.3 | 619.4 | 613.4 | 644.0 | 671.0 | 682.9 | 722.5 | 688.7 | 683.8 | 673.6 | 658.2 |
| 2008 | 603.5 | 619.1 | 604.1 | 618.2 | 597.7 | 603.1 | 607.0 | 636.6 | 622.6 | 650.9 | 629.7 | 667.8 |
| 2009 | 584.0 | 583.3 | 590.9 | 627.9 | 636.4 | 657.7 | 685.3 | 706.0 | 698.6 | 676.0 | 636.5 | 660.5 |
| 2010 | 585.3 | 599.3 | 644.8 | 659.3 | 710.5 | 730.4 | 757.7 | 748.6 | 663.1 | 695.2 | 671.4 | 658.1 |
| 2011 | 586.5 | 601.9 | 613.9 | 591.5 | 582.9 | 646.1 | 668.0 | 674.8 | 661.3 | 651.0 | 650.8 | 661.3 |
| 2012 | 564.2 | 583.3 | 605.0 | 614.6 | 680.2 | 709.4 | 689.4 | 689.8 | 633.4 | 640.2 | 635.2 | 615.1 |
| 2013 | 588.8 | 577.3 | 596.2 | 626.0 | 679.1 | 700.6 | 675.2 | 631.0 | 583.8 | 573.8 | 613.8 | 589.2 |
| 2014 | 548.8 | 570.6 | 577.7 | 602.0 | 658.2 | 649.9 | 585.8 | 631.9 | 620.1 | 600.0 | 575.8 | 584.6 |
| 2015 | 682.4 | 694.8 | 694.4 | 740.6 | 787.8 | 811.2 | 814.4 | 859.0 | 814.6 | 804.1 | 753.2 | 747.6 |
| 2016 | 745.6 | 769.3 | 790.7 | 830.6 | 851.5 | 979.7 | 997.3 | 978.8 | 965.8 | 936.2 | 922.7 | 880.5 |
| 2017 | 780.6 | 800.8 | 843.6 | 872.3 | 919.5 | 956.0 | 914.3 | 782.5 | 713.9 | 734.6 | 745.4 | 713.2 |
| 2018 | 759.7 | 742.3 | 719.8 | 752.2 | 802.5 | 817.6 | 812.2 | 826.1 | 790.5 | 727.7 | 771.9 | 764.1 |
| 2019 | 712.7 | 707.2 | 724.7 | 792.6 | 827.3 | 842.2 | 866.2 | 870.5 | 845.6 | 847.8 | 832.7 | 802.8 |
| 2020 | 768.8 | 806.4 | 660.8 | 445.9 | 615.5 | 787.6 | 844.7 | 875.0 | 847.3 | 828.7 | 782.1 | 733.7 |
| 2021 | 684.2 | 708.6 | 758.4 | 791.4 | 837.0 | 894.7 | 865.0 | 895.3 | 877.0 | 872.2 | 825.2 | 790.9 |
| 2022 | 746.7 | 756.6 | 702.1 | |||||||||
| - = No Data Reported; -- = Not Applicable; NA = Not Available; W = Withheld to avoid disclosure of individual company data. |
| Release Date: 5/19/2022 |
| Next Release Date: TBD |