|
Download Data (XLS File) |
|
||||||||
|
||||||||
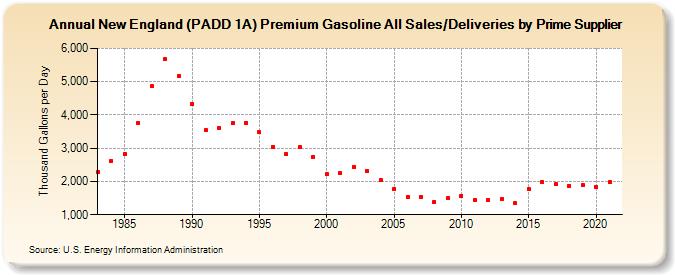
| New England (PADD 1A) Premium Gasoline All Sales/Deliveries by Prime Supplier (Thousand Gallons per Day) | ||||||||
| Decade | Year-0 | Year-1 | Year-2 | Year-3 | Year-4 | Year-5 | Year-6 | Year-7 | Year-8 | Year-9 |
|---|---|---|---|---|---|---|---|---|---|---|
| 1980's | 2,269.6 | 2,615.8 | 2,838.8 | 3,766.0 | 4,855.0 | 5,675.2 | 5,166.2 | |||
| 1990's | 4,322.1 | 3,538.6 | 3,619.5 | 3,747.1 | 3,767.9 | 3,477.8 | 3,044.4 | 2,822.3 | 3,027.2 | 2,736.7 |
| 2000's | 2,215.3 | 2,250.3 | 2,442.1 | 2,302.3 | 2,042.7 | 1,773.8 | 1,538.6 | 1,539.9 | 1,391.5 | 1,487.7 |
| 2010's | 1,575.9 | 1,444.6 | 1,440.1 | 1,473.0 | 1,341.4 | 1,760.8 | 1,986.7 | 1,915.0 | 1,871.3 | 1,878.4 |
| 2020's | 1,830.6 |
| - = No Data Reported; -- = Not Applicable; NA = Not Available; W = Withheld to avoid disclosure of individual company data. |
| Release Date: 6/1/2022 |
| Next Release Date: TBD |