|
Download Data (XLS File) |
|
||||||||
|
||||||||
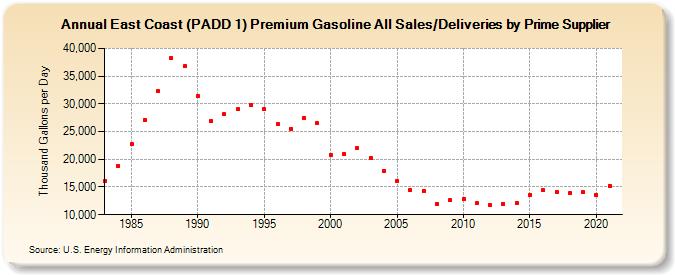
| East Coast (PADD 1) Premium Gasoline All Sales/Deliveries by Prime Supplier (Thousand Gallons per Day) | ||||||||
| Decade | Year-0 | Year-1 | Year-2 | Year-3 | Year-4 | Year-5 | Year-6 | Year-7 | Year-8 | Year-9 |
|---|---|---|---|---|---|---|---|---|---|---|
| 1980's | 16,042.4 | 18,834.7 | 22,694.8 | 27,098.7 | 32,286.0 | 38,226.9 | 36,776.7 | |||
| 1990's | 31,490.9 | 26,933.4 | 28,110.6 | 29,005.8 | 29,704.5 | 29,030.4 | 26,305.7 | 25,521.1 | 27,451.8 | 26,493.8 |
| 2000's | 20,796.8 | 20,989.8 | 21,971.2 | 20,225.5 | 17,934.3 | 15,991.9 | 14,434.2 | 14,321.8 | 11,944.4 | 12,601.3 |
| 2010's | 12,861.4 | 12,054.2 | 11,718.6 | 11,936.6 | 12,139.8 | 13,640.8 | 14,392.2 | 14,136.1 | 13,843.0 | 14,023.1 |
| 2020's | 13,511.2 |
| - = No Data Reported; -- = Not Applicable; NA = Not Available; W = Withheld to avoid disclosure of individual company data. |
| Release Date: 6/1/2022 |
| Next Release Date: TBD |