|
Download Data (XLS File) |
|
||||||||
|
||||||||
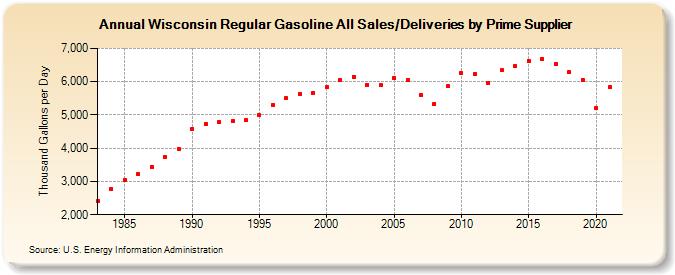
| Wisconsin Regular Gasoline All Sales/Deliveries by Prime Supplier (Thousand Gallons per Day) | ||||||||
| Decade | Year-0 | Year-1 | Year-2 | Year-3 | Year-4 | Year-5 | Year-6 | Year-7 | Year-8 | Year-9 |
|---|---|---|---|---|---|---|---|---|---|---|
| 1980's | 2,414.7 | 2,767.9 | 3,041.4 | 3,220.9 | 3,437.2 | 3,740.2 | 3,983.7 | |||
| 1990's | 4,579.6 | 4,737.9 | 4,778.3 | 4,812.2 | 4,852.3 | 4,982.9 | 5,311.8 | 5,500.4 | 5,628.0 | 5,664.9 |
| 2000's | 5,832.9 | 6,048.2 | 6,149.7 | 5,913.7 | 5,888.7 | 6,112.4 | 6,042.0 | 5,608.3 | 5,337.3 | 5,864.9 |
| 2010's | 6,253.2 | 6,225.4 | 5,960.0 | 6,336.6 | 6,455.6 | 6,629.3 | 6,688.1 | 6,545.7 | 6,280.5 | 6,054.4 |
| 2020's | 5,193.1 |
| - = No Data Reported; -- = Not Applicable; NA = Not Available; W = Withheld to avoid disclosure of individual company data. |
| Release Date: 6/1/2022 |
| Next Release Date: TBD |