|
Download Data (XLS File) |
|
||||||||
|
||||||||
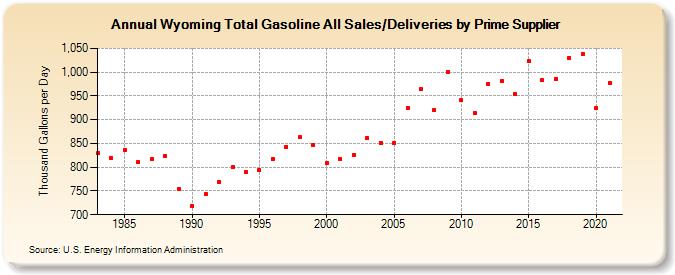
| Wyoming Total Gasoline All Sales/Deliveries by Prime Supplier (Thousand Gallons per Day) | ||||||||
| Decade | Year-0 | Year-1 | Year-2 | Year-3 | Year-4 | Year-5 | Year-6 | Year-7 | Year-8 | Year-9 |
|---|---|---|---|---|---|---|---|---|---|---|
| 1980's | 829.0 | 819.3 | 837.2 | 810.4 | 816.7 | 824.0 | 753.7 | |||
| 1990's | 719.1 | 744.1 | 768.6 | 800.4 | 789.4 | 794.2 | 818.1 | 843.3 | 863.0 | 846.9 |
| 2000's | 808.6 | 816.5 | 826.2 | 861.5 | 851.2 | 851.8 | 925.3 | 963.5 | 920.0 | 999.9 |
| 2010's | 940.6 | 914.3 | 975.5 | 982.1 | 953.2 | 1,022.7 | 982.9 | 985.7 | 1,030.4 | 1,038.7 |
| 2020's | 924.0 |
| - = No Data Reported; -- = Not Applicable; NA = Not Available; W = Withheld to avoid disclosure of individual company data. |
| Release Date: 6/1/2022 |
| Next Release Date: TBD |