|
Download Data (XLS File) |
|
||||||||
|
||||||||
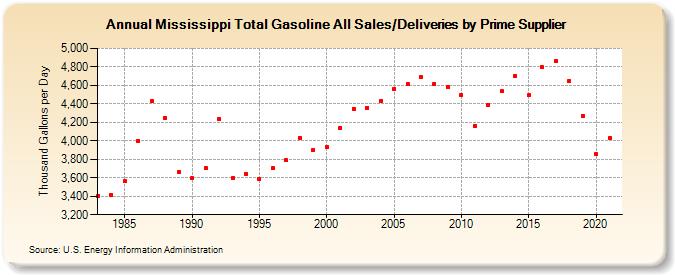
| Mississippi Total Gasoline All Sales/Deliveries by Prime Supplier (Thousand Gallons per Day) | ||||||||
| Decade | Year-0 | Year-1 | Year-2 | Year-3 | Year-4 | Year-5 | Year-6 | Year-7 | Year-8 | Year-9 |
|---|---|---|---|---|---|---|---|---|---|---|
| 1980's | 3,399.1 | 3,413.2 | 3,563.4 | 4,000.6 | 4,428.6 | 4,246.9 | 3,666.6 | |||
| 1990's | 3,594.8 | 3,706.7 | 4,240.1 | 3,596.3 | 3,643.7 | 3,585.0 | 3,705.5 | 3,788.9 | 4,033.4 | 3,898.8 |
| 2000's | 3,934.3 | 4,143.3 | 4,344.2 | 4,358.4 | 4,430.0 | 4,564.8 | 4,614.4 | 4,685.9 | 4,613.4 | 4,581.2 |
| 2010's | 4,497.9 | 4,157.6 | 4,389.6 | 4,534.5 | 4,699.9 | 4,490.6 | 4,795.3 | 4,861.1 | 4,649.5 | 4,272.7 |
| 2020's | 3,855.3 |
| - = No Data Reported; -- = Not Applicable; NA = Not Available; W = Withheld to avoid disclosure of individual company data. |
| Release Date: 6/1/2022 |
| Next Release Date: TBD |