|
Download Data (XLS File) |
|
||||||||
|
||||||||
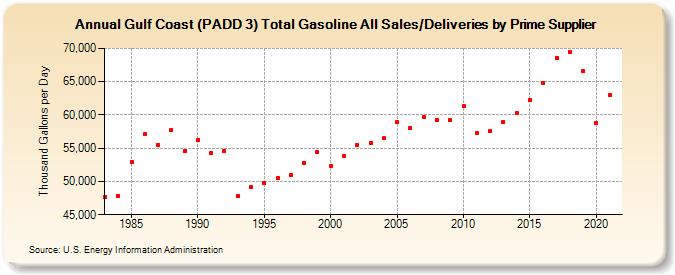
| Gulf Coast (PADD 3) Total Gasoline All Sales/Deliveries by Prime Supplier (Thousand Gallons per Day) | ||||||||
| Decade | Year-0 | Year-1 | Year-2 | Year-3 | Year-4 | Year-5 | Year-6 | Year-7 | Year-8 | Year-9 |
|---|---|---|---|---|---|---|---|---|---|---|
| 1980's | 47,705.5 | 47,860.2 | 52,973.7 | 57,076.7 | 55,522.0 | 57,693.4 | 54,573.9 | |||
| 1990's | 56,204.0 | 54,226.2 | 54,601.2 | 47,845.6 | 49,102.0 | 49,768.3 | 50,533.8 | 50,980.2 | 52,828.2 | 54,416.1 |
| 2000's | 52,262.8 | 53,796.7 | 55,449.6 | 55,762.4 | 56,478.9 | 58,862.9 | 58,041.8 | 59,739.9 | 59,295.6 | 59,241.3 |
| 2010's | 61,411.6 | 57,326.3 | 57,523.3 | 58,937.0 | 60,252.5 | 62,273.1 | 64,784.6 | 68,542.8 | 69,530.0 | 66,553.1 |
| 2020's | 58,842.7 |
| - = No Data Reported; -- = Not Applicable; NA = Not Available; W = Withheld to avoid disclosure of individual company data. |
| Release Date: 6/1/2022 |
| Next Release Date: TBD |