|
Download Data (XLS File) |
|
||||||||
|
||||||||
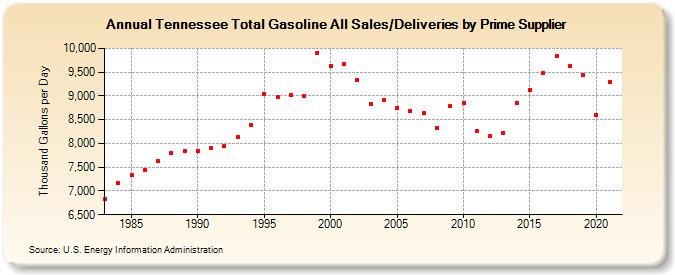
| Tennessee Total Gasoline All Sales/Deliveries by Prime Supplier (Thousand Gallons per Day) | ||||||||
| Decade | Year-0 | Year-1 | Year-2 | Year-3 | Year-4 | Year-5 | Year-6 | Year-7 | Year-8 | Year-9 |
|---|---|---|---|---|---|---|---|---|---|---|
| 1980's | 6,830.2 | 7,167.2 | 7,327.0 | 7,431.4 | 7,640.7 | 7,808.5 | 7,844.0 | |||
| 1990's | 7,842.9 | 7,893.8 | 7,955.8 | 8,141.0 | 8,385.9 | 9,038.6 | 8,967.7 | 9,010.1 | 9,002.3 | 9,908.1 |
| 2000's | 9,637.0 | 9,668.8 | 9,333.4 | 8,830.8 | 8,907.9 | 8,754.2 | 8,680.9 | 8,647.9 | 8,325.1 | 8,781.2 |
| 2010's | 8,857.5 | 8,262.3 | 8,147.8 | 8,226.5 | 8,852.8 | 9,134.2 | 9,484.6 | 9,832.1 | 9,633.8 | 9,438.0 |
| 2020's | 8,596.8 |
| - = No Data Reported; -- = Not Applicable; NA = Not Available; W = Withheld to avoid disclosure of individual company data. |
| Release Date: 6/1/2022 |
| Next Release Date: TBD |