|
Download Data (XLS File) |
|
||||||||
|
||||||||
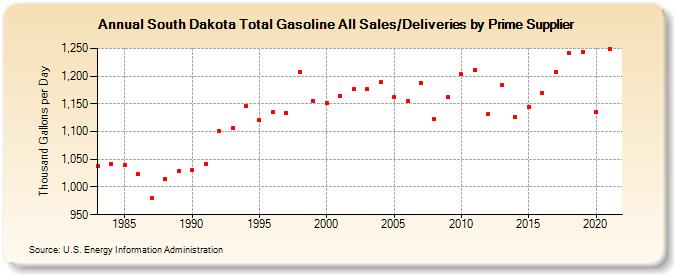
| South Dakota Total Gasoline All Sales/Deliveries by Prime Supplier (Thousand Gallons per Day) | ||||||||
| Decade | Year-0 | Year-1 | Year-2 | Year-3 | Year-4 | Year-5 | Year-6 | Year-7 | Year-8 | Year-9 |
|---|---|---|---|---|---|---|---|---|---|---|
| 1980's | 1,037.7 | 1,041.4 | 1,039.3 | 1,022.8 | 980.1 | 1,014.1 | 1,028.8 | |||
| 1990's | 1,030.4 | 1,041.8 | 1,100.8 | 1,106.0 | 1,146.5 | 1,120.0 | 1,134.7 | 1,134.2 | 1,208.1 | 1,155.7 |
| 2000's | 1,150.8 | 1,164.7 | 1,176.8 | 1,176.2 | 1,188.7 | 1,161.7 | 1,155.1 | 1,188.4 | 1,122.0 | 1,161.5 |
| 2010's | 1,203.1 | 1,211.9 | 1,131.8 | 1,183.2 | 1,125.4 | 1,144.6 | 1,169.2 | 1,208.0 | 1,240.8 | 1,244.1 |
| 2020's | 1,135.9 |
| - = No Data Reported; -- = Not Applicable; NA = Not Available; W = Withheld to avoid disclosure of individual company data. |
| Release Date: 6/1/2022 |
| Next Release Date: TBD |