|
Download Data (XLS File) |
|
||||||||
|
||||||||
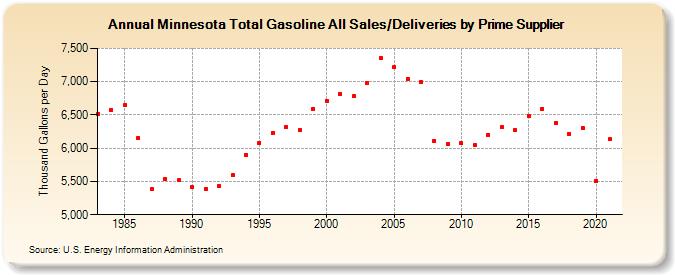
| Minnesota Total Gasoline All Sales/Deliveries by Prime Supplier (Thousand Gallons per Day) | ||||||||
| Decade | Year-0 | Year-1 | Year-2 | Year-3 | Year-4 | Year-5 | Year-6 | Year-7 | Year-8 | Year-9 |
|---|---|---|---|---|---|---|---|---|---|---|
| 1980's | 6,513.0 | 6,575.5 | 6,646.6 | 6,157.8 | 5,380.1 | 5,534.1 | 5,517.1 | |||
| 1990's | 5,409.4 | 5,390.1 | 5,429.6 | 5,594.5 | 5,902.9 | 6,080.0 | 6,234.2 | 6,316.1 | 6,274.9 | 6,592.6 |
| 2000's | 6,714.0 | 6,813.6 | 6,777.8 | 6,986.7 | 7,354.6 | 7,215.2 | 7,046.9 | 7,000.6 | 6,113.8 | 6,061.3 |
| 2010's | 6,073.4 | 6,042.6 | 6,205.5 | 6,316.3 | 6,268.6 | 6,483.2 | 6,592.5 | 6,382.7 | 6,218.3 | 6,305.1 |
| 2020's | 5,509.6 |
| - = No Data Reported; -- = Not Applicable; NA = Not Available; W = Withheld to avoid disclosure of individual company data. |
| Release Date: 6/1/2022 |
| Next Release Date: TBD |