|
Download Data (XLS File) |
|
||||||||
|
||||||||
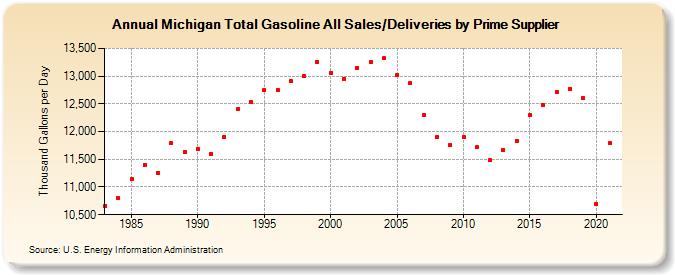
| Michigan Total Gasoline All Sales/Deliveries by Prime Supplier (Thousand Gallons per Day) | ||||||||
| Decade | Year-0 | Year-1 | Year-2 | Year-3 | Year-4 | Year-5 | Year-6 | Year-7 | Year-8 | Year-9 |
|---|---|---|---|---|---|---|---|---|---|---|
| 1980's | 10,658.1 | 10,804.1 | 11,139.3 | 11,403.3 | 11,260.7 | 11,785.6 | 11,638.3 | |||
| 1990's | 11,686.7 | 11,602.8 | 11,909.3 | 12,405.5 | 12,529.3 | 12,753.7 | 12,746.4 | 12,908.4 | 13,001.4 | 13,261.9 |
| 2000's | 13,061.2 | 12,953.6 | 13,148.6 | 13,249.2 | 13,318.6 | 13,017.5 | 12,867.8 | 12,294.0 | 11,893.2 | 11,763.0 |
| 2010's | 11,902.4 | 11,715.9 | 11,480.6 | 11,669.3 | 11,835.3 | 12,290.2 | 12,472.2 | 12,721.2 | 12,775.6 | 12,602.4 |
| 2020's | 10,691.9 |
| - = No Data Reported; -- = Not Applicable; NA = Not Available; W = Withheld to avoid disclosure of individual company data. |
| Release Date: 6/1/2022 |
| Next Release Date: TBD |