|
Download Data (XLS File) |
|
||||||||
|
||||||||
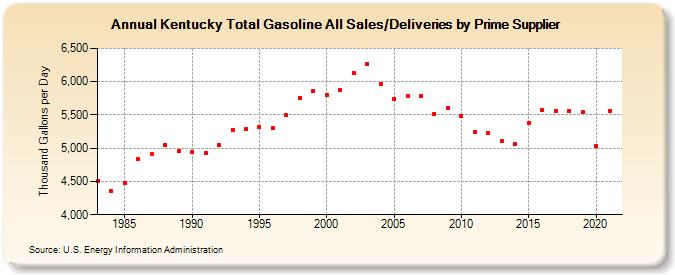
| Kentucky Total Gasoline All Sales/Deliveries by Prime Supplier (Thousand Gallons per Day) | ||||||||
| Decade | Year-0 | Year-1 | Year-2 | Year-3 | Year-4 | Year-5 | Year-6 | Year-7 | Year-8 | Year-9 |
|---|---|---|---|---|---|---|---|---|---|---|
| 1980's | 4,511.4 | 4,360.3 | 4,471.5 | 4,832.0 | 4,915.6 | 5,052.9 | 4,952.2 | |||
| 1990's | 4,944.1 | 4,924.0 | 5,046.7 | 5,270.6 | 5,285.9 | 5,314.0 | 5,298.4 | 5,492.9 | 5,750.8 | 5,864.9 |
| 2000's | 5,799.7 | 5,875.6 | 6,130.0 | 6,265.1 | 5,965.2 | 5,744.1 | 5,780.0 | 5,791.0 | 5,511.9 | 5,609.7 |
| 2010's | 5,481.7 | 5,247.1 | 5,223.9 | 5,103.1 | 5,059.3 | 5,382.8 | 5,575.1 | 5,564.1 | 5,563.5 | 5,537.0 |
| 2020's | 5,031.7 |
| - = No Data Reported; -- = Not Applicable; NA = Not Available; W = Withheld to avoid disclosure of individual company data. |
| Release Date: 6/1/2022 |
| Next Release Date: TBD |