|
Download Data (XLS File) |
|
||||||||
|
||||||||
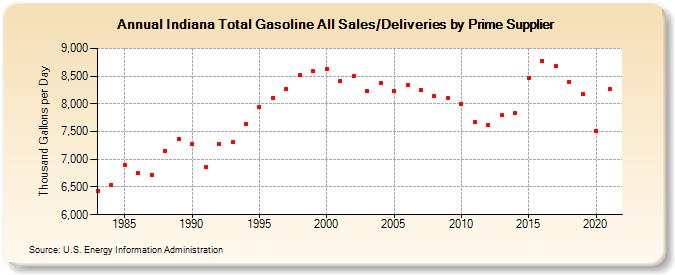
| Indiana Total Gasoline All Sales/Deliveries by Prime Supplier (Thousand Gallons per Day) | ||||||||
| Decade | Year-0 | Year-1 | Year-2 | Year-3 | Year-4 | Year-5 | Year-6 | Year-7 | Year-8 | Year-9 |
|---|---|---|---|---|---|---|---|---|---|---|
| 1980's | 6,428.3 | 6,541.1 | 6,897.7 | 6,747.1 | 6,724.6 | 7,147.5 | 7,372.5 | |||
| 1990's | 7,267.2 | 6,864.1 | 7,276.6 | 7,303.4 | 7,639.1 | 7,937.7 | 8,110.9 | 8,259.6 | 8,512.8 | 8,595.0 |
| 2000's | 8,625.0 | 8,420.6 | 8,500.6 | 8,227.6 | 8,379.7 | 8,230.0 | 8,337.4 | 8,255.3 | 8,133.9 | 8,110.6 |
| 2010's | 8,004.5 | 7,674.5 | 7,621.8 | 7,791.5 | 7,832.5 | 8,474.5 | 8,772.8 | 8,674.1 | 8,396.8 | 8,173.2 |
| 2020's | 7,517.8 |
| - = No Data Reported; -- = Not Applicable; NA = Not Available; W = Withheld to avoid disclosure of individual company data. |
| Release Date: 6/1/2022 |
| Next Release Date: TBD |