|
Download Data (XLS File) |
|
||||||||
|
||||||||
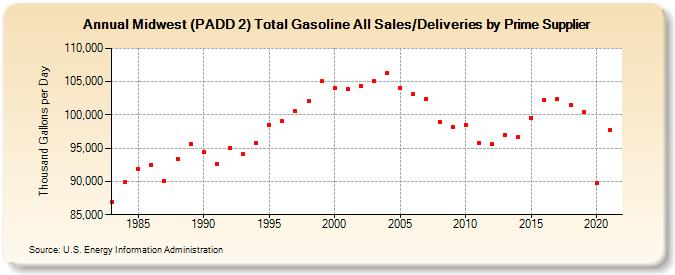
| Midwest (PADD 2) Total Gasoline All Sales/Deliveries by Prime Supplier (Thousand Gallons per Day) | ||||||||
| Decade | Year-0 | Year-1 | Year-2 | Year-3 | Year-4 | Year-5 | Year-6 | Year-7 | Year-8 | Year-9 |
|---|---|---|---|---|---|---|---|---|---|---|
| 1980's | 86,919.7 | 89,907.8 | 91,884.2 | 92,494.7 | 90,062.5 | 93,440.1 | 95,631.6 | |||
| 1990's | 94,354.5 | 92,611.3 | 95,085.3 | 94,060.1 | 95,735.1 | 98,517.1 | 99,041.4 | 100,515.5 | 102,108.6 | 105,029.7 |
| 2000's | 104,074.0 | 103,892.0 | 104,350.5 | 105,071.7 | 106,272.3 | 104,119.9 | 103,099.9 | 102,467.1 | 98,999.7 | 98,217.3 |
| 2010's | 98,491.5 | 95,826.2 | 95,555.8 | 96,979.9 | 96,608.3 | 99,592.4 | 102,179.7 | 102,365.5 | 101,455.2 | 100,403.1 |
| 2020's | 89,692.2 |
| - = No Data Reported; -- = Not Applicable; NA = Not Available; W = Withheld to avoid disclosure of individual company data. |
| Release Date: 6/1/2022 |
| Next Release Date: TBD |