|
Download Data (XLS File) |
|
||||||||
|
||||||||
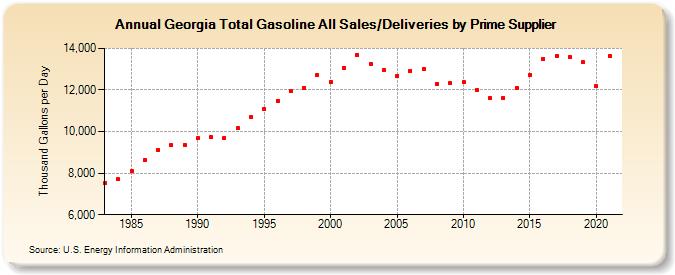
| Georgia Total Gasoline All Sales/Deliveries by Prime Supplier (Thousand Gallons per Day) | ||||||||
| Decade | Year-0 | Year-1 | Year-2 | Year-3 | Year-4 | Year-5 | Year-6 | Year-7 | Year-8 | Year-9 |
|---|---|---|---|---|---|---|---|---|---|---|
| 1980's | 7,506.1 | 7,699.2 | 8,078.7 | 8,637.1 | 9,127.9 | 9,343.4 | 9,374.8 | |||
| 1990's | 9,676.4 | 9,733.0 | 9,692.0 | 10,148.1 | 10,677.7 | 11,096.1 | 11,484.8 | 11,937.4 | 12,116.3 | 12,722.1 |
| 2000's | 12,404.5 | 13,076.8 | 13,684.5 | 13,253.5 | 12,956.5 | 12,696.0 | 12,927.7 | 12,984.8 | 12,296.7 | 12,326.9 |
| 2010's | 12,387.2 | 11,986.9 | 11,626.0 | 11,614.4 | 12,115.5 | 12,725.1 | 13,508.8 | 13,644.1 | 13,594.4 | 13,329.8 |
| 2020's | 12,184.3 |
| - = No Data Reported; -- = Not Applicable; NA = Not Available; W = Withheld to avoid disclosure of individual company data. |
| Release Date: 6/1/2022 |
| Next Release Date: TBD |