|
Download Data (XLS File) |
|
||||||||
|
||||||||
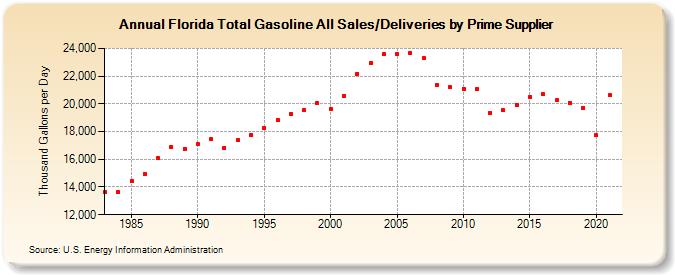
| Florida Total Gasoline All Sales/Deliveries by Prime Supplier (Thousand Gallons per Day) | ||||||||
| Decade | Year-0 | Year-1 | Year-2 | Year-3 | Year-4 | Year-5 | Year-6 | Year-7 | Year-8 | Year-9 |
|---|---|---|---|---|---|---|---|---|---|---|
| 1980's | 13,656.0 | 13,642.0 | 14,427.5 | 14,953.3 | 16,062.7 | 16,908.5 | 16,757.6 | |||
| 1990's | 17,095.3 | 17,453.8 | 16,845.7 | 17,368.0 | 17,748.3 | 18,239.0 | 18,853.9 | 19,253.6 | 19,539.8 | 20,052.4 |
| 2000's | 19,649.4 | 20,583.7 | 22,174.7 | 22,963.5 | 23,576.0 | 23,578.6 | 23,669.7 | 23,315.1 | 21,366.2 | 21,191.8 |
| 2010's | 21,091.3 | 21,056.1 | 19,373.0 | 19,521.1 | 19,938.3 | 20,523.7 | 20,706.3 | 20,251.8 | 20,083.9 | 19,732.8 |
| 2020's | 17,731.8 |
| - = No Data Reported; -- = Not Applicable; NA = Not Available; W = Withheld to avoid disclosure of individual company data. |
| Release Date: 6/1/2022 |
| Next Release Date: TBD |