|
Download Data (XLS File) |
|
||||||||
|
||||||||
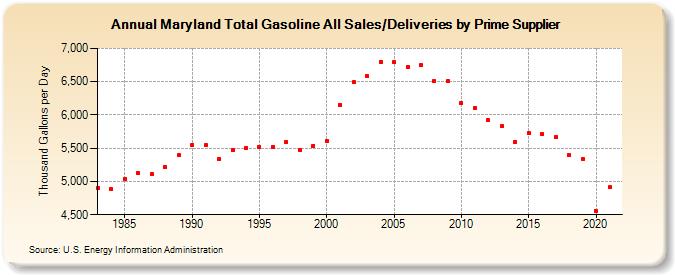
| Maryland Total Gasoline All Sales/Deliveries by Prime Supplier (Thousand Gallons per Day) | ||||||||
| Decade | Year-0 | Year-1 | Year-2 | Year-3 | Year-4 | Year-5 | Year-6 | Year-7 | Year-8 | Year-9 |
|---|---|---|---|---|---|---|---|---|---|---|
| 1980's | 4,897.3 | 4,879.1 | 5,038.6 | 5,124.2 | 5,105.6 | 5,214.4 | 5,394.2 | |||
| 1990's | 5,549.8 | 5,541.0 | 5,337.3 | 5,468.0 | 5,503.7 | 5,518.7 | 5,523.4 | 5,592.1 | 5,470.0 | 5,536.7 |
| 2000's | 5,606.5 | 6,154.9 | 6,494.4 | 6,579.6 | 6,795.4 | 6,788.6 | 6,717.2 | 6,746.1 | 6,507.1 | 6,506.5 |
| 2010's | 6,179.5 | 6,104.6 | 5,918.3 | 5,830.4 | 5,591.4 | 5,726.1 | 5,713.5 | 5,665.5 | 5,393.8 | 5,338.5 |
| 2020's | 4,562.1 |
| - = No Data Reported; -- = Not Applicable; NA = Not Available; W = Withheld to avoid disclosure of individual company data. |
| Release Date: 6/1/2022 |
| Next Release Date: TBD |