|
Download Data (XLS File) |
|
||||||||
|
||||||||
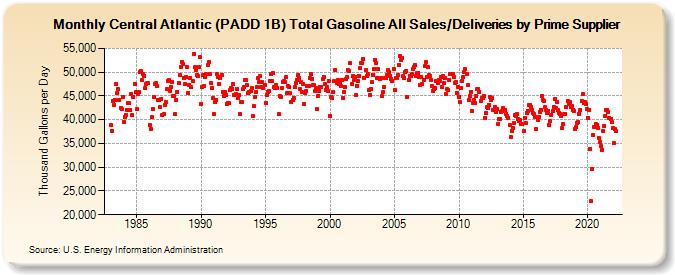
| Central Atlantic (PADD 1B) Total Gasoline All Sales/Deliveries by Prime Supplier (Thousand Gallons per Day) | ||||||||
| Year | Jan | Feb | Mar | Apr | May | Jun | Jul | Aug | Sep | Oct | Nov | Dec |
|---|---|---|---|---|---|---|---|---|---|---|---|---|
| 1983 | 38,797.6 | 37,586.4 | 44,029.7 | 43,167.2 | 44,147.6 | 47,429.5 | 45,565.8 | 46,379.2 | 44,213.7 | 42,414.9 | 42,297.7 | 44,736.6 |
| 1984 | 39,486.8 | 40,519.7 | 41,044.5 | 41,936.7 | 43,550.2 | 43,448.1 | 41,992.9 | 45,368.2 | 41,021.3 | 44,800.5 | 47,588.2 | 45,758.6 |
| 1985 | 42,177.7 | 45,416.8 | 45,822.4 | 50,082.9 | 50,189.7 | 48,285.7 | 49,576.4 | 49,294.5 | 46,628.2 | 47,461.6 | 47,722.2 | 47,642.7 |
| 1986 | 38,812.5 | 37,987.1 | 40,475.3 | 42,283.8 | 44,826.2 | 47,486.7 | 47,679.1 | 47,014.2 | 44,167.6 | 44,177.5 | 42,703.9 | 44,350.8 |
| 1987 | 40,886.9 | 41,174.6 | 43,182.1 | 43,614.9 | 46,454.7 | 48,149.2 | 48,350.0 | 46,117.2 | 46,939.6 | 47,931.8 | 45,031.5 | 44,898.8 |
| 1988 | 41,111.0 | 44,207.4 | 45,830.2 | 47,773.7 | 49,344.3 | 51,174.4 | 52,189.3 | 51,705.0 | 48,825.3 | 47,426.5 | 49,078.0 | 51,044.5 |
| 1989 | 45,665.5 | 47,387.3 | 48,872.7 | 46,771.3 | 48,059.6 | 53,858.2 | 50,982.4 | 50,405.8 | 49,497.3 | 49,138.6 | 51,025.3 | 53,117.6 |
| 1990 | 43,362.3 | 46,804.6 | 49,313.8 | 47,101.6 | 48,910.4 | 49,538.1 | 51,469.7 | 52,101.8 | 49,606.6 | 47,753.6 | 46,612.1 | 44,469.1 |
| 1991 | 41,163.5 | 43,683.3 | 44,158.7 | 49,522.8 | 49,017.4 | 47,579.0 | 48,856.3 | 49,380.9 | 45,807.6 | 44,968.5 | 45,894.2 | 45,194.1 |
| 1992 | 43,368.1 | 43,450.0 | 43,466.3 | 46,149.0 | 46,669.3 | 46,518.5 | 47,418.6 | 45,122.3 | 45,420.0 | 46,542.7 | 44,506.7 | 45,115.4 |
| 1993 | 41,243.7 | 43,642.0 | 43,753.5 | 46,544.1 | 46,969.6 | 48,290.4 | 48,356.1 | 47,262.3 | 45,696.1 | 45,755.9 | 46,087.3 | 46,700.9 |
| 1994 | 40,864.0 | 42,945.8 | 44,699.7 | 45,789.6 | 46,816.4 | 48,757.2 | 47,994.5 | 49,107.2 | 46,921.4 | 47,859.1 | 46,760.2 | 47,350.9 |
| 1995 | 43,578.4 | 45,101.6 | 45,912.9 | 45,990.0 | 48,094.1 | 49,536.0 | 48,076.1 | 49,865.5 | 46,844.8 | 46,736.0 | 47,260.9 | 46,621.2 |
| 1996 | 41,089.9 | 45,058.3 | 44,678.7 | 46,628.0 | 47,870.1 | 48,124.9 | 48,018.7 | 48,942.9 | 45,654.2 | 47,091.0 | 46,910.6 | 45,510.1 |
| 1997 | 43,692.5 | 44,063.0 | 44,637.8 | 46,797.4 | 47,697.8 | 48,449.2 | 49,319.6 | 48,776.9 | 46,443.1 | 47,875.6 | 45,732.4 | 47,456.5 |
| 1998 | 43,373.7 | 45,638.6 | 46,032.1 | 47,058.3 | 47,059.5 | 48,827.4 | 49,528.3 | 48,468.5 | 47,321.9 | 47,195.9 | 45,951.8 | 46,610.5 |
| 1999 | 42,223.8 | 45,033.4 | 46,053.3 | 46,852.7 | 46,952.2 | 48,519.7 | 49,084.8 | 47,420.1 | 46,296.7 | 46,777.9 | 46,047.6 | 48,174.1 |
| 2000 | 40,690.9 | 44,745.9 | 44,489.7 | 45,913.5 | 48,086.4 | 50,540.7 | 47,791.7 | 48,301.3 | 47,464.5 | 47,753.8 | 47,175.7 | 48,352.0 |
| 2001 | 44,585.9 | 45,814.9 | 46,908.6 | 48,459.4 | 48,946.0 | 50,431.0 | 50,272.5 | 51,829.2 | 47,509.4 | 49,236.5 | 48,314.4 | 49,053.7 |
| 2002 | 45,099.6 | 47,037.9 | 48,058.4 | 49,249.7 | 50,788.4 | 51,988.6 | 51,935.4 | 52,689.2 | 48,862.7 | 50,378.3 | 49,264.2 | 49,628.3 |
| 2003 | 46,157.4 | 45,210.8 | 46,458.6 | 47,963.2 | 49,493.7 | 50,582.2 | 52,606.5 | 51,862.0 | 48,837.8 | 50,593.2 | 48,647.5 | 48,818.7 |
| 2004 | 44,989.3 | 45,774.5 | 46,961.2 | 48,869.3 | 48,735.9 | 49,368.5 | 50,367.0 | 50,067.8 | 49,128.5 | 48,489.8 | 48,203.8 | 50,673.1 |
| 2005 | 46,329.8 | 48,688.0 | 48,698.4 | 49,301.6 | 51,542.9 | 53,312.1 | 52,539.9 | 52,968.2 | 49,135.0 | 48,764.7 | 49,989.1 | 50,243.5 |
| 2006 | 44,753.9 | 48,301.4 | 49,265.1 | 49,159.2 | 49,567.8 | 50,586.1 | 51,101.2 | 51,531.1 | 49,277.4 | 49,743.5 | 49,894.2 | 48,901.1 |
| 2007 | 47,341.2 | 49,073.8 | 47,533.8 | 48,327.8 | 51,291.4 | 52,073.5 | 49,055.6 | 51,022.3 | 49,367.3 | 49,204.4 | 48,358.2 | 47,069.8 |
| 2008 | 45,969.0 | 46,540.7 | 46,579.2 | 48,056.7 | 47,820.3 | 48,268.1 | 48,158.8 | 48,974.6 | 46,876.4 | 49,249.6 | 47,628.0 | 48,696.4 |
| 2009 | 45,447.0 | 46,399.6 | 46,140.3 | 48,451.1 | 49,518.7 | 49,666.7 | 49,607.2 | 48,901.0 | 47,704.3 | 47,920.6 | 45,684.2 | 46,929.1 |
| 2010 | 44,707.8 | 43,692.2 | 46,749.6 | 48,197.8 | 48,895.6 | 49,996.5 | 50,582.7 | 49,688.4 | 47,276.5 | 44,097.6 | 44,970.0 | 45,868.2 |
| 2011 | 41,928.5 | 43,591.0 | 44,093.3 | 43,491.1 | 45,063.6 | 46,371.3 | 46,543.2 | 45,907.1 | 44,016.9 | 44,611.1 | 44,538.0 | 44,981.5 |
| 2012 | 40,260.5 | 41,464.6 | 42,569.7 | 42,520.5 | 43,188.4 | 44,838.6 | 44,114.2 | 44,546.9 | 41,986.7 | 42,726.0 | 41,615.9 | 42,349.3 |
| 2013 | 39,096.1 | 40,122.5 | 40,120.0 | 41,665.6 | 41,737.2 | 42,371.2 | 42,040.6 | 42,068.1 | 41,170.2 | 40,670.5 | 40,324.0 | 38,836.0 |
| 2014 | 36,334.6 | 37,673.9 | 38,157.1 | 39,297.1 | 41,083.1 | 40,771.9 | 41,269.0 | 40,120.3 | 39,712.8 | 39,887.5 | 39,097.9 | 39,074.7 |
| 2015 | 37,521.5 | 40,371.1 | 39,256.7 | 41,500.0 | 41,845.5 | 43,075.7 | 43,109.4 | 42,686.1 | 41,992.3 | 41,323.5 | 41,139.3 | 40,584.2 |
| 2016 | 37,958.3 | 39,987.0 | 40,530.2 | 41,596.9 | 42,088.2 | 45,053.8 | 44,112.1 | 43,872.5 | 42,646.8 | 42,058.5 | 41,425.2 | 41,898.3 |
| 2017 | 38,777.5 | 39,691.9 | 41,059.8 | 41,820.4 | 42,759.6 | 44,376.4 | 42,389.7 | 43,821.4 | 41,960.1 | 41,357.8 | 41,216.6 | 40,832.1 |
| 2018 | 38,283.3 | 39,090.2 | 41,122.5 | 41,230.1 | 42,670.5 | 43,930.6 | 43,366.8 | 43,616.3 | 42,646.0 | 42,810.9 | 42,102.9 | 41,794.1 |
| 2019 | 38,100.4 | 38,488.8 | 39,230.2 | 39,433.1 | 41,292.9 | 41,989.3 | 43,956.5 | 45,359.4 | 43,412.9 | 43,719.1 | 43,362.7 | 42,344.8 |
| 2020 | 40,416.0 | 42,093.8 | 33,901.9 | 22,813.5 | 29,675.8 | 36,751.7 | 38,560.0 | 39,095.1 | 38,956.6 | 38,184.8 | 36,152.1 | 35,293.8 |
| 2021 | 34,362.7 | 33,639.2 | 37,571.3 | 38,688.5 | 40,783.7 | 41,956.8 | 41,961.5 | 41,555.6 | 40,383.4 | 40,051.2 | 39,497.8 | 38,337.5 |
| 2022 | 34,995.3 | 38,068.5 | 37,675.2 | |||||||||
| - = No Data Reported; -- = Not Applicable; NA = Not Available; W = Withheld to avoid disclosure of individual company data. |
| Release Date: 5/19/2022 |
| Next Release Date: TBD |