|
Download Data (XLS File) |
|
||||||||
|
||||||||
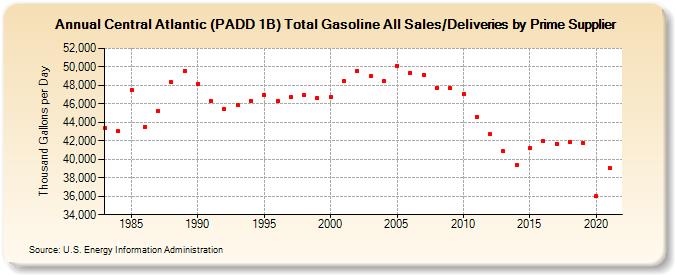
| Central Atlantic (PADD 1B) Total Gasoline All Sales/Deliveries by Prime Supplier (Thousand Gallons per Day) | ||||||||
| Decade | Year-0 | Year-1 | Year-2 | Year-3 | Year-4 | Year-5 | Year-6 | Year-7 | Year-8 | Year-9 |
|---|---|---|---|---|---|---|---|---|---|---|
| 1980's | 43,435.3 | 43,051.8 | 47,535.2 | 43,535.1 | 45,253.2 | 48,321.7 | 49,575.1 | |||
| 1990's | 48,096.1 | 46,279.9 | 45,442.9 | 45,868.0 | 46,341.9 | 46,978.6 | 46,301.5 | 46,766.0 | 46,928.7 | 46,629.3 |
| 2000's | 46,775.7 | 48,465.9 | 49,599.8 | 48,965.8 | 48,479.2 | 50,134.5 | 49,344.4 | 49,139.6 | 47,741.7 | 47,706.2 |
| 2010's | 47,081.9 | 44,602.9 | 42,687.8 | 40,852.0 | 39,383.5 | 41,204.2 | 41,938.1 | 41,680.8 | 41,905.2 | 41,747.2 |
| 2020's | 35,983.3 |
| - = No Data Reported; -- = Not Applicable; NA = Not Available; W = Withheld to avoid disclosure of individual company data. |
| Release Date: 6/1/2022 |
| Next Release Date: TBD |