|
Download Data (XLS File) |
|
||||||||
|
||||||||
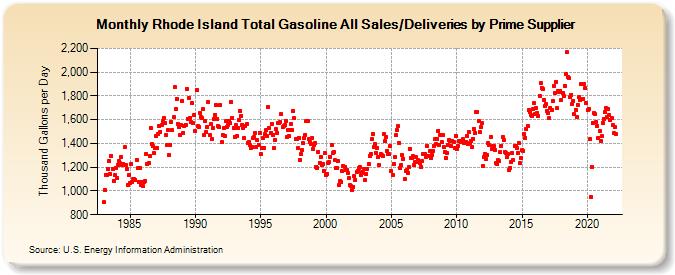
| Rhode Island Total Gasoline All Sales/Deliveries by Prime Supplier (Thousand Gallons per Day) | ||||||||
| Year | Jan | Feb | Mar | Apr | May | Jun | Jul | Aug | Sep | Oct | Nov | Dec |
|---|---|---|---|---|---|---|---|---|---|---|---|---|
| 1983 | 904.5 | 1,005.1 | 1,136.7 | 1,134.5 | 1,182.9 | 1,254.2 | 1,144.3 | 1,295.6 | 1,185.9 | 1,086.2 | 1,131.2 | 1,195.8 |
| 1984 | 1,112.9 | 1,220.9 | 1,250.1 | 1,231.1 | 1,285.1 | 1,220.6 | 1,227.1 | 1,365.8 | 1,218.6 | 1,183.0 | 1,051.6 | 1,135.1 |
| 1985 | 1,067.3 | 1,229.5 | 1,077.2 | 1,104.0 | 1,099.1 | 1,092.3 | 1,263.2 | 1,190.6 | 1,078.0 | 1,196.5 | 1,050.3 | 1,072.7 |
| 1986 | 1,041.3 | 1,071.9 | 1,085.3 | 1,314.5 | 1,227.0 | 1,232.5 | 1,298.3 | 1,533.6 | 1,394.4 | 1,374.9 | 1,320.0 | 1,360.8 |
| 1987 | 1,461.5 | 1,360.3 | 1,480.3 | 1,544.1 | 1,498.6 | 1,555.1 | 1,592.5 | 1,614.8 | 1,575.8 | 1,473.6 | 1,390.0 | 1,513.4 |
| 1988 | 1,301.5 | 1,389.7 | 1,579.3 | 1,510.9 | 1,619.2 | 1,872.5 | 1,689.6 | 1,776.5 | 1,566.0 | 1,535.7 | 1,470.0 | 1,553.0 |
| 1989 | 1,760.2 | 1,488.9 | 1,545.5 | 1,558.3 | 1,861.7 | 1,609.4 | 1,782.1 | 1,618.0 | 1,581.2 | 1,740.1 | 1,569.0 | 1,638.6 |
| 1990 | 1,503.1 | 1,851.0 | 1,546.7 | 1,536.6 | 1,652.7 | 1,622.8 | 1,618.1 | 1,685.7 | 1,468.6 | 1,586.5 | 1,496.6 | 1,540.2 |
| 1991 | 1,748.9 | 1,470.9 | 1,559.7 | 1,436.1 | 1,530.6 | 1,605.9 | 1,637.9 | 1,723.1 | 1,606.7 | 1,549.4 | 1,539.4 | 1,722.4 |
| 1992 | 1,408.2 | 1,470.8 | 1,531.9 | 1,465.1 | 1,584.7 | 1,541.1 | 1,555.3 | 1,590.5 | 1,573.9 | 1,750.0 | 1,614.4 | 1,533.5 |
| 1993 | 1,458.0 | 1,554.6 | 1,463.9 | 1,532.5 | 1,596.3 | 1,675.2 | 1,634.6 | 1,558.2 | 1,526.9 | 1,446.4 | 1,546.9 | 1,559.9 |
| 1994 | 1,407.0 | 1,411.4 | 1,383.1 | 1,358.7 | 1,372.9 | 1,445.9 | 1,457.3 | 1,490.1 | 1,371.9 | 1,425.7 | 1,389.4 | 1,490.3 |
| 1995 | 1,310.1 | 1,365.1 | 1,443.5 | 1,364.8 | 1,477.9 | 1,509.2 | 1,461.0 | 1,710.1 | 1,528.5 | 1,490.6 | 1,564.9 | 1,469.4 |
| 1996 | 1,360.7 | 1,432.0 | 1,518.7 | 1,491.5 | 1,571.1 | 1,575.7 | 1,579.5 | 1,645.8 | 1,536.7 | 1,550.5 | 1,552.6 | 1,591.0 |
| 1997 | 1,455.5 | 1,509.3 | 1,461.0 | 1,513.8 | 1,564.5 | 1,512.6 | 1,671.2 | 1,612.3 | 1,433.9 | 1,436.3 | 1,358.5 | 1,448.7 |
| 1998 | 1,261.4 | 1,310.6 | 1,345.5 | 1,400.4 | 1,447.5 | 1,473.8 | 1,588.5 | 1,586.9 | 1,434.2 | 1,416.0 | 1,399.2 | 1,447.2 |
| 1999 | 1,354.8 | 1,385.5 | 1,399.7 | 1,202.6 | 1,196.2 | 1,329.4 | 1,239.3 | 1,286.0 | 1,220.2 | 1,229.7 | 1,170.2 | 1,316.7 |
| 2000 | 1,135.3 | 1,144.0 | 1,233.9 | 1,242.9 | 1,288.3 | 1,388.0 | 1,321.7 | 1,331.5 | 1,257.8 | 1,191.3 | 1,196.1 | 1,255.3 |
| 2001 | 1,049.3 | 1,084.1 | 1,074.1 | 1,164.2 | 1,208.7 | 1,200.4 | 1,180.2 | 1,180.0 | 1,154.7 | 1,108.1 | 1,046.8 | 1,037.8 |
| 2002 | 1,007.4 | 1,036.8 | 1,122.0 | 1,094.3 | 1,161.6 | 1,169.4 | 1,193.8 | 1,202.6 | 1,130.7 | 1,156.3 | 1,149.6 | 1,182.7 |
| 2003 | 1,092.2 | 1,144.3 | 1,188.3 | 1,228.8 | 1,295.5 | 1,313.6 | 1,434.9 | 1,478.1 | 1,367.1 | 1,393.4 | 1,318.1 | 1,363.4 |
| 2004 | 1,286.5 | 1,216.4 | 1,312.5 | 1,302.6 | 1,295.4 | 1,476.4 | 1,417.2 | 1,455.5 | 1,340.1 | 1,312.0 | 1,309.8 | 1,376.9 |
| 2005 | 1,167.2 | 1,135.3 | 1,228.2 | 1,282.0 | 1,468.6 | 1,510.1 | 1,544.6 | 1,405.2 | 1,191.9 | 1,219.6 | 1,302.5 | 1,271.3 |
| 2006 | 1,098.9 | 1,169.4 | 1,177.0 | 1,153.8 | 1,201.2 | 1,355.7 | 1,276.8 | 1,273.5 | 1,291.9 | 1,215.4 | 1,241.2 | 1,285.2 |
| 2007 | 1,262.2 | 1,244.2 | 1,237.8 | 1,205.6 | 1,251.4 | 1,310.5 | 1,313.5 | 1,314.6 | 1,288.4 | 1,375.6 | 1,292.2 | 1,334.1 |
| 2008 | 1,273.6 | 1,304.8 | 1,340.5 | 1,382.5 | 1,435.3 | 1,395.6 | 1,435.4 | 1,507.6 | 1,388.8 | 1,470.4 | 1,408.4 | 1,471.1 |
| 2009 | 1,366.9 | 1,329.0 | 1,278.5 | 1,319.9 | 1,383.6 | 1,427.6 | 1,424.4 | 1,375.8 | 1,424.6 | 1,409.1 | 1,359.8 | 1,465.5 |
| 2010 | 1,351.2 | 1,376.3 | 1,416.9 | 1,420.7 | 1,414.5 | 1,416.0 | 1,435.3 | 1,405.7 | 1,416.0 | 1,462.6 | 1,398.8 | 1,495.1 |
| 2011 | 1,403.9 | 1,421.5 | 1,365.8 | 1,440.2 | 1,523.6 | 1,488.6 | 1,666.3 | 1,664.7 | 1,592.2 | 1,498.0 | 1,535.4 | 1,569.5 |
| 2012 | 1,213.5 | 1,288.1 | 1,313.3 | 1,266.5 | 1,298.8 | 1,401.0 | 1,385.7 | 1,454.5 | 1,351.1 | 1,380.8 | 1,379.7 | 1,345.0 |
| 2013 | 1,231.3 | 1,227.6 | 1,259.4 | 1,251.2 | 1,324.8 | 1,380.6 | 1,455.4 | 1,427.8 | 1,331.8 | 1,317.9 | 1,287.1 | 1,309.2 |
| 2014 | 1,177.5 | 1,197.4 | 1,242.9 | 1,319.9 | 1,257.9 | 1,381.0 | 1,375.0 | 1,364.9 | 1,321.7 | 1,402.3 | 1,232.5 | 1,276.7 |
| 2015 | 1,344.3 | 1,339.3 | 1,479.6 | 1,448.3 | 1,520.5 | 1,548.3 | 1,679.9 | 1,665.9 | 1,641.0 | 1,627.4 | 1,686.8 | 1,737.8 |
| 2016 | 1,644.9 | 1,700.8 | 1,654.6 | 1,629.4 | 1,799.3 | 1,905.6 | 1,870.0 | 1,859.9 | 1,766.4 | 1,712.4 | 1,730.4 | 1,676.0 |
| 2017 | 1,659.9 | 1,611.1 | 1,699.2 | 1,683.2 | 1,756.0 | 1,886.3 | 1,826.3 | 1,919.5 | 1,695.4 | 1,841.2 | 1,829.1 | 1,843.0 |
| 2018 | 1,767.7 | 1,826.6 | 1,796.1 | 1,887.6 | 1,984.2 | 2,166.2 | 1,963.0 | 1,950.6 | 1,787.0 | 1,810.8 | 1,735.0 | 1,753.4 |
| 2019 | 1,644.0 | 1,685.6 | 1,623.7 | 1,726.2 | 1,789.6 | 1,763.8 | 1,899.0 | 1,900.1 | 1,776.4 | 1,901.3 | 1,868.5 | 1,738.5 |
| 2020 | 1,682.6 | 1,692.3 | 1,434.9 | 951.7 | 1,203.4 | 1,575.1 | 1,658.2 | 1,644.5 | 1,578.8 | 1,549.0 | 1,449.9 | 1,500.8 |
| 2021 | 1,419.0 | 1,462.1 | 1,576.0 | 1,608.5 | 1,661.2 | 1,699.4 | 1,624.2 | 1,694.0 | 1,635.7 | 1,593.7 | 1,611.4 | 1,556.5 |
| 2022 | 1,483.8 | 1,540.0 | 1,479.4 | |||||||||
| - = No Data Reported; -- = Not Applicable; NA = Not Available; W = Withheld to avoid disclosure of individual company data. |
| Release Date: 5/19/2022 |
| Next Release Date: TBD |