|
Download Data (XLS File) |
|
||||||||
|
||||||||
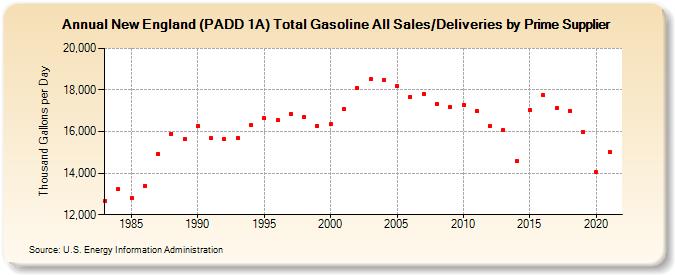
| New England (PADD 1A) Total Gasoline All Sales/Deliveries by Prime Supplier (Thousand Gallons per Day) | ||||||||
| Decade | Year-0 | Year-1 | Year-2 | Year-3 | Year-4 | Year-5 | Year-6 | Year-7 | Year-8 | Year-9 |
|---|---|---|---|---|---|---|---|---|---|---|
| 1980's | 12,668.4 | 13,217.9 | 12,821.7 | 13,393.2 | 14,935.6 | 15,900.7 | 15,631.9 | |||
| 1990's | 16,277.0 | 15,674.9 | 15,621.6 | 15,712.6 | 16,298.5 | 16,632.2 | 16,550.1 | 16,834.4 | 16,712.1 | 16,260.9 |
| 2000's | 16,348.7 | 17,072.8 | 18,105.2 | 18,511.5 | 18,485.4 | 18,175.6 | 17,683.3 | 17,818.7 | 17,328.6 | 17,181.3 |
| 2010's | 17,270.6 | 17,000.4 | 16,279.8 | 16,067.1 | 14,580.0 | 17,023.4 | 17,754.0 | 17,145.7 | 16,997.0 | 15,980.0 |
| 2020's | 14,032.4 |
| - = No Data Reported; -- = Not Applicable; NA = Not Available; W = Withheld to avoid disclosure of individual company data. |
| Release Date: 6/1/2022 |
| Next Release Date: TBD |