|
Download Data (XLS File) |
|
||||||||
|
||||||||
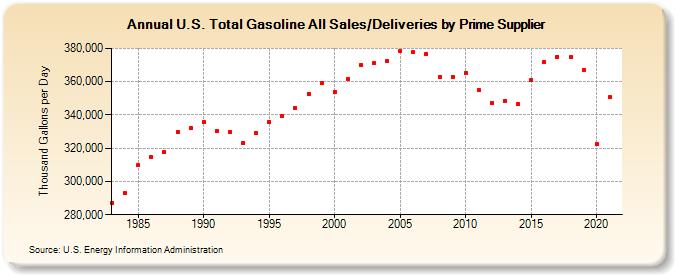
| U.S. Total Gasoline All Sales/Deliveries by Prime Supplier (Thousand Gallons per Day) | ||||||||
| Decade | Year-0 | Year-1 | Year-2 | Year-3 | Year-4 | Year-5 | Year-6 | Year-7 | Year-8 | Year-9 |
|---|---|---|---|---|---|---|---|---|---|---|
| 1980's | 287,126.3 | 292,841.4 | 309,627.2 | 314,488.7 | 317,555.9 | 329,770.9 | 331,959.1 | |||
| 1990's | 335,818.8 | 330,203.7 | 329,882.8 | 322,976.3 | 329,180.8 | 335,842.1 | 339,463.1 | 344,196.1 | 352,591.5 | 359,083.7 |
| 2000's | 353,899.6 | 361,723.8 | 370,312.8 | 370,939.5 | 372,310.6 | 378,473.4 | 377,608.5 | 376,636.4 | 362,968.6 | 362,798.5 |
| 2010's | 365,247.6 | 354,951.9 | 347,234.5 | 348,657.3 | 346,707.6 | 361,056.3 | 371,725.6 | 375,118.3 | 374,602.1 | 367,306.0 |
| 2020's | 322,498.3 |
| - = No Data Reported; -- = Not Applicable; NA = Not Available; W = Withheld to avoid disclosure of individual company data. |
| Release Date: 6/1/2022 |
| Next Release Date: TBD |