|
Download Data (XLS File) |
|
||||||||
|
||||||||
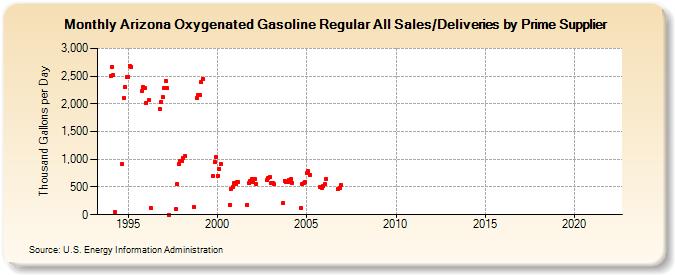
| Arizona Oxygenated Gasoline Regular All Sales/Deliveries by Prime Supplier (Thousand Gallons per Day) | ||||||||
| Year | Jan | Feb | Mar | Apr | May | Jun | Jul | Aug | Sep | Oct | Nov | Dec |
|---|---|---|---|---|---|---|---|---|---|---|---|---|
| 1993 | NA | NA | NA | |||||||||
| 1994 | 2,504.1 | 2,672.9 | 2,518.5 | 54.2 | W | W | W | W | 920.4 | 2,096.5 | 2,309.9 | 2,490.3 |
| 1995 | 2,491.6 | 2,679.0 | 2,672.1 | W | - | - | - | - | W | 2,230.9 | 2,307.2 | 2,284.5 |
| 1996 | 2,016.7 | W | 2,067.5 | 129.8 | W | - | - | - | W | 1,911.7 | 2,034.1 | 2,120.0 |
| 1997 | 2,294.0 | 2,420.0 | 2,283.7 | 2.9 | - | - | - | - | 102.1 | 553.9 | 911.4 | 969.9 |
| 1998 | 963.3 | 1,029.7 | 1,056.2 | W | - | - | W | W | 141.3 | W | 2,104.6 | 2,167.6 |
| 1999 | 2,155.3 | 2,390.7 | 2,449.9 | W | - | - | - | - | W | 704.8 | 949.6 | 1,036.3 |
| 2000 | 703.5 | 833.1 | 921.8 | - | - | - | - | - | 183.7 | 461.8 | 500.1 | 569.0 |
| 2001 | 559.0 | 596.8 | 587.0 | - | - | - | - | - | 183.1 | 571.5 | 603.3 | 643.6 |
| 2002 | 584.5 | 643.9 | 557.1 | - | - | - | - | - | W | 620.8 | 658.8 | 678.3 |
| 2003 | 576.1 | 576.1 | 546.9 | - | - | - | - | - | 213.0 | 615.9 | 584.6 | 585.8 |
| 2004 | 629.6 | 640.6 | 580.1 | W | - | - | - | - | 128.0 | 554.6 | 570.5 | 594.4 |
| 2005 | 748.8 | 780.3 | 724.3 | W | - | - | - | - | W | 491.5 | 486.0 | 525.2 |
| 2006 | 556.4 | 647.3 | W | - | - | - | - | - | W | 467.2 | 487.3 | 531.9 |
| 2007 | - | - | - | - | - | - | - | - | - | - | - | - |
| 2008 | - | - | - | - | - | - | - | - | - | - | - | - |
| 2009 | - | - | - | - | - | - | - | - | - | - | - | - |
| 2010 | - | - | - | - | - | - | - | - | - | - | - | - |
| 2011 | - | - | - | - | - | - | - | - | - | - | - | - |
| 2012 | - | - | - | - | - | - | - | - | - | - | - | - |
| 2013 | - | - | - | - | - | - | - | - | - | - | - | - |
| 2014 | - | - | - | - | - | - | - | - | - | - | - | - |
| 2015 | - | - | - | - | - | - | - | - | - | - | - | - |
| 2016 | - | - | - | - | - | - | - | - | - | - | - | - |
| 2017 | - | - | - | - | - | - | - | - | - | - | - | - |
| 2018 | - | - | - | - | - | - | - | - | - | - | - | - |
| 2019 | - | - | - | - | - | - | - | - | - | - | - | - |
| 2020 | - | - | - | - | - | - | - | - | - | - | - | - |
| 2021 | - | - | - | - | - | - | - | - | - | - | - | - |
| 2022 | - | - | - | |||||||||
| - = No Data Reported; -- = Not Applicable; NA = Not Available; W = Withheld to avoid disclosure of individual company data. |
| Release Date: 5/19/2022 |
| Next Release Date: TBD |