|
Download Data (XLS File) |
|
||||||||
|
||||||||
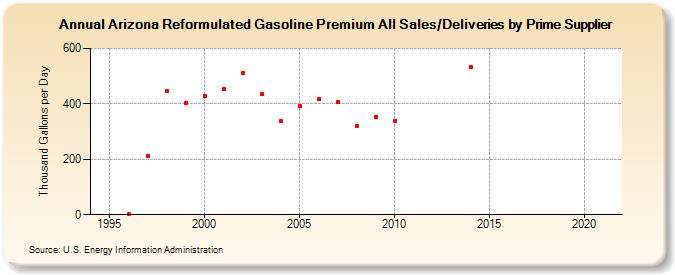
| Arizona Reformulated Gasoline Premium All Sales/Deliveries by Prime Supplier (Thousand Gallons per Day) | ||||||||
| Decade | Year-0 | Year-1 | Year-2 | Year-3 | Year-4 | Year-5 | Year-6 | Year-7 | Year-8 | Year-9 |
|---|---|---|---|---|---|---|---|---|---|---|
| 1990's | - | W | 0.9 | 212.9 | 447.4 | 401.4 | ||||
| 2000's | 427.4 | 455.0 | 510.0 | 435.8 | 336.5 | 393.5 | 416.5 | 407.7 | 319.0 | 351.4 |
| 2010's | 339.0 | W | W | W | 531.8 | W | W | W | W | W |
| 2020's | W |
| - = No Data Reported; -- = Not Applicable; NA = Not Available; W = Withheld to avoid disclosure of individual company data. |
| Release Date: 6/1/2022 |
| Next Release Date: TBD |