|
Download Data (XLS File) |
|
||||||||
|
||||||||
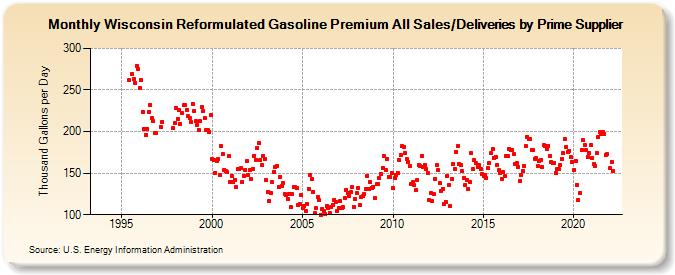
| Wisconsin Reformulated Gasoline Premium All Sales/Deliveries by Prime Supplier (Thousand Gallons per Day) | ||||||||
| Year | Jan | Feb | Mar | Apr | May | Jun | Jul | Aug | Sep | Oct | Nov | Dec |
|---|---|---|---|---|---|---|---|---|---|---|---|---|
| 1993 | - | - | - | |||||||||
| 1994 | - | - | - | - | - | - | - | - | - | - | W | W |
| 1995 | W | W | W | W | W | 262.0 | W | 269.3 | 263.6 | 258.9 | 278.9 | 275.6 |
| 1996 | 251.9 | 261.5 | 223.9 | 202.9 | 196.0 | 203.2 | 223.9 | 232.1 | 216.4 | 212.5 | 197.8 | 197.8 |
| 1997 | W | W | 205.8 | 211.6 | W | W | W | W | W | W | 204.0 | 210.1 |
| 1998 | 228.7 | 215.3 | 226.2 | 209.1 | 222.5 | 231.5 | 231.4 | 226.4 | 218.2 | 216.2 | 211.1 | 233.5 |
| 1999 | 224.5 | 212.3 | 207.9 | 201.9 | 212.3 | 229.6 | 224.2 | 216.3 | 201.4 | 201.3 | 199.9 | 219.9 |
| 2000 | 167.1 | 165.6 | 150.5 | 164.8 | 166.9 | 148.2 | 182.2 | 172.7 | 154.2 | 152.8 | 150.8 | 170.7 |
| 2001 | 139.5 | 146.8 | 138.8 | 142.2 | 133.3 | 154.4 | 155.5 | 155.6 | 139.7 | 146.8 | 154.3 | 164.5 |
| 2002 | 147.6 | 153.4 | 142.5 | 155.3 | 171.0 | 165.6 | 180.5 | 186.5 | 165.6 | 160.1 | 170.7 | 167.2 |
| 2003 | 141.9 | 127.9 | 116.5 | 126.1 | 138.9 | 151.4 | 157.7 | 159.1 | 133.6 | 145.7 | 134.4 | 137.9 |
| 2004 | 125.0 | 123.6 | 118.9 | 125.0 | 108.7 | 124.4 | 133.4 | 133.0 | 132.1 | 112.2 | 112.8 | 123.5 |
| 2005 | 107.7 | 110.1 | 104.4 | 113.1 | 131.3 | 148.3 | 142.7 | 127.8 | 102.0 | 107.5 | 121.3 | 117.3 |
| 2006 | 100.2 | 106.9 | 104.3 | 100.4 | 110.0 | 108.0 | 101.9 | 109.6 | 111.8 | 118.1 | 115.8 | 105.0 |
| 2007 | 108.0 | 116.0 | 108.2 | 108.9 | 120.0 | 129.8 | 126.5 | 122.9 | 127.3 | 133.1 | 109.3 | 119.1 |
| 2008 | 125.8 | 132.3 | 111.6 | 120.7 | 122.5 | 124.5 | 130.9 | 147.1 | 130.5 | 139.5 | 131.8 | 133.8 |
| 2009 | 119.8 | 136.5 | 137.2 | 144.0 | 149.4 | 156.7 | 170.9 | 153.6 | 166.8 | 145.7 | 145.3 | 150.3 |
| 2010 | 131.8 | 144.2 | 147.5 | 150.6 | 165.7 | 171.9 | 182.1 | 181.5 | 173.7 | 166.9 | 163.2 | 158.2 |
| 2011 | 137.5 | 138.8 | 135.5 | 129.4 | 141.7 | 159.4 | 158.6 | 171.1 | 157.1 | 160.3 | 154.7 | 150.7 |
| 2012 | 118.1 | 126.1 | 116.7 | 124.6 | 142.8 | 159.2 | 153.7 | 138.0 | 128.8 | 131.3 | 113.3 | 115.8 |
| 2013 | 147.1 | 136.0 | 109.9 | 143.0 | 160.4 | 155.3 | 175.8 | 182.4 | 160.5 | 159.3 | 152.2 | 144.5 |
| 2014 | 135.9 | 141.6 | 131.4 | 139.6 | 174.2 | 154.8 | 165.3 | 161.6 | 157.5 | 159.5 | 154.9 | 148.7 |
| 2015 | 146.6 | 147.8 | 143.9 | 155.8 | 161.9 | 173.9 | 178.5 | 168.6 | 169.8 | 159.8 | 153.3 | 150.7 |
| 2016 | 143.2 | 151.2 | 146.1 | 170.8 | 171.0 | 179.1 | 177.6 | 178.2 | 173.0 | 160.6 | 161.9 | 157.9 |
| 2017 | 140.4 | 147.4 | 153.0 | 158.5 | 182.3 | 194.0 | 190.9 | 191.5 | 178.3 | 177.6 | 167.4 | 168.0 |
| 2018 | 158.3 | 165.0 | 165.8 | 157.5 | 183.3 | 183.2 | 179.4 | 183.1 | 170.3 | 163.5 | 161.9 | 162.4 |
| 2019 | 150.7 | 154.8 | 154.9 | 159.6 | 167.2 | 173.7 | 191.6 | 181.5 | 175.0 | 177.1 | 168.9 | 163.5 |
| 2020 | 153.9 | 164.9 | 135.8 | 118.1 | 126.3 | 178.1 | 190.0 | 184.1 | 178.1 | 169.9 | 174.0 | 183.6 |
| 2021 | 168.7 | 160.7 | 158.3 | 174.6 | 193.6 | 198.9 | 196.9 | 199.2 | 197.2 | 171.5 | 172.8 | W |
| 2022 | 155.8 | 163.3 | 152.1 | |||||||||
| - = No Data Reported; -- = Not Applicable; NA = Not Available; W = Withheld to avoid disclosure of individual company data. |
| Release Date: 5/19/2022 |
| Next Release Date: TBD |