|
Download Data (XLS File) |
|
||||||||
|
||||||||
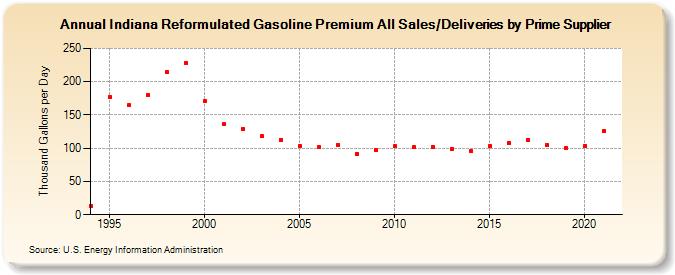
| Indiana Reformulated Gasoline Premium All Sales/Deliveries by Prime Supplier (Thousand Gallons per Day) | ||||||||
| Decade | Year-0 | Year-1 | Year-2 | Year-3 | Year-4 | Year-5 | Year-6 | Year-7 | Year-8 | Year-9 |
|---|---|---|---|---|---|---|---|---|---|---|
| 1990's | 12.4 | 177.6 | 164.2 | 180.0 | 214.8 | 228.3 | ||||
| 2000's | 170.8 | 135.7 | 129.2 | 117.8 | 112.9 | 103.5 | 101.2 | 105.4 | 91.7 | 96.8 |
| 2010's | 102.7 | 101.1 | 101.7 | 99.4 | 95.4 | 103.6 | 108.0 | 112.5 | 104.9 | 100.6 |
| 2020's | 103.7 |
| - = No Data Reported; -- = Not Applicable; NA = Not Available; W = Withheld to avoid disclosure of individual company data. |
| Release Date: 6/1/2022 |
| Next Release Date: TBD |