|
Download Data (XLS File) |
|
||||||||
|
||||||||
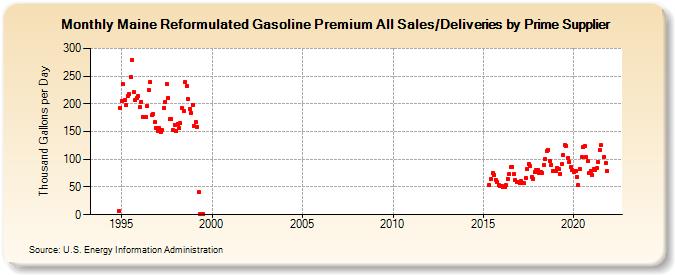
| Maine Reformulated Gasoline Premium All Sales/Deliveries by Prime Supplier (Thousand Gallons per Day) | ||||||||
| Year | Jan | Feb | Mar | Apr | May | Jun | Jul | Aug | Sep | Oct | Nov | Dec |
|---|---|---|---|---|---|---|---|---|---|---|---|---|
| 1993 | - | - | - | |||||||||
| 1994 | - | - | - | - | - | - | - | - | - | - | 6.4 | 192.7 |
| 1995 | 205.3 | 235.3 | 206.7 | 197.3 | 214.8 | 218.4 | 248.6 | 278.3 | 220.7 | 207.2 | 211.0 | 213.3 |
| 1996 | 193.7 | 204.0 | 176.8 | 176.2 | 176.7 | 195.5 | 224.1 | 239.4 | 179.1 | 181.7 | 166.5 | 156.7 |
| 1997 | 150.4 | 156.3 | 149.8 | 152.4 | 192.8 | 203.9 | 235.0 | 211.4 | 172.5 | 172.8 | 153.6 | 162.3 |
| 1998 | 150.4 | 164.3 | 156.3 | 165.3 | 192.3 | 187.9 | 239.3 | 231.4 | 208.1 | 190.4 | 183.7 | 197.9 |
| 1999 | 160.0 | 167.6 | 158.9 | 40.4 | 0.5 | W | 0.4 | W | W | - | - | - |
| 2000 | W | W | W | W | - | - | - | - | - | - | - | - |
| 2001 | - | - | - | - | - | - | - | - | - | - | - | - |
| 2002 | - | - | - | - | - | - | - | - | - | - | - | - |
| 2003 | - | - | - | - | - | - | - | - | - | - | - | - |
| 2004 | - | - | - | - | - | - | - | - | - | - | - | - |
| 2005 | - | - | - | - | - | - | - | - | - | - | - | - |
| 2006 | - | - | - | - | - | - | - | - | - | - | - | - |
| 2007 | - | - | - | - | - | - | - | - | - | - | - | - |
| 2008 | - | - | - | - | - | - | - | - | - | - | - | - |
| 2009 | - | - | - | - | - | - | - | - | - | - | - | - |
| 2010 | - | - | - | - | - | - | - | - | - | - | - | - |
| 2011 | - | - | - | - | - | - | - | - | - | - | - | - |
| 2012 | - | - | - | - | - | - | - | - | - | - | - | - |
| 2013 | - | - | - | - | - | - | - | - | - | - | - | - |
| 2014 | - | - | - | - | - | - | - | - | - | - | - | - |
| 2015 | - | - | - | W | 52.7 | 63.7 | 74.8 | 72.0 | 63.3 | 58.9 | 53.4 | 52.1 |
| 2016 | 52.1 | 49.9 | 50.8 | 52.7 | 65.2 | 73.1 | 85.8 | 86.7 | 73.0 | 62.5 | 59.0 | 59.5 |
| 2017 | 56.5 | 60.2 | 56.9 | 56.7 | 66.1 | 82.3 | 91.8 | 87.2 | 68.6 | 65.1 | 77.4 | 81.3 |
| 2018 | 80.8 | 74.8 | 77.5 | 76.1 | 90.2 | 99.7 | 115.4 | 117.1 | 97.3 | 89.9 | 78.7 | 79.3 |
| 2019 | 78.0 | 84.6 | 81.7 | 73.3 | 91.2 | 107.2 | 125.2 | 124.0 | 101.4 | 95.1 | 86.2 | 80.4 |
| 2020 | 77.3 | 79.7 | 68.9 | 52.8 | 82.4 | 103.8 | 121.5 | 123.5 | 103.9 | 97.1 | 75.2 | 79.6 |
| 2021 | 71.3 | 82.7 | 80.2 | 83.8 | 94.6 | 116.4 | 124.9 | W | 104.8 | 93.5 | 78.0 | W |
| 2022 | W | W | W | |||||||||
| - = No Data Reported; -- = Not Applicable; NA = Not Available; W = Withheld to avoid disclosure of individual company data. |
| Release Date: 5/19/2022 |
| Next Release Date: TBD |