|
Download Data (XLS File) |
|
||||||||
|
||||||||
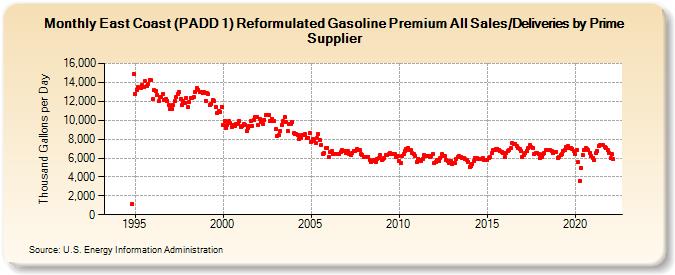
| East Coast (PADD 1) Reformulated Gasoline Premium All Sales/Deliveries by Prime Supplier (Thousand Gallons per Day) | ||||||||
| Year | Jan | Feb | Mar | Apr | May | Jun | Jul | Aug | Sep | Oct | Nov | Dec |
|---|---|---|---|---|---|---|---|---|---|---|---|---|
| 1993 | - | - | - | |||||||||
| 1994 | - | - | - | - | - | - | - | - | - | - | 1,098.1 | 14,883.7 |
| 1995 | 12,800.8 | 13,240.6 | 13,482.0 | W | 13,381.5 | 13,722.6 | 13,496.2 | 14,106.6 | 13,570.9 | 13,793.8 | 14,280.8 | 14,203.0 |
| 1996 | 12,207.8 | 13,164.8 | 13,091.4 | 12,653.9 | 11,978.3 | 12,466.0 | 12,458.2 | 12,808.7 | 12,137.7 | 12,284.2 | 12,076.7 | 11,599.1 |
| 1997 | 11,149.1 | 11,227.3 | 11,577.8 | 11,995.5 | 12,450.2 | 12,788.0 | 12,987.1 | 12,286.7 | 11,565.2 | 12,080.8 | 11,776.7 | 12,370.9 |
| 1998 | 11,369.2 | 11,903.6 | 12,352.3 | 12,301.4 | 12,433.3 | 12,956.6 | 13,358.4 | 13,221.9 | 12,981.0 | 12,942.4 | 12,859.3 | 12,990.7 |
| 1999 | 12,063.3 | 12,838.8 | 12,740.6 | 11,642.8 | 11,663.8 | 12,187.0 | 12,041.1 | 11,409.3 | 10,801.6 | 10,933.5 | 10,880.5 | 11,448.7 |
| 2000 | 9,540.9 | 9,922.2 | 9,187.7 | 9,480.4 | 9,880.5 | 9,653.6 | 9,327.1 | 9,514.0 | 9,430.7 | 9,626.7 | 9,606.0 | 9,917.8 |
| 2001 | 9,229.8 | 9,337.9 | 9,565.3 | 9,524.3 | 8,863.2 | 9,153.0 | 9,383.4 | 9,893.1 | 9,403.4 | 10,024.7 | 10,300.0 | 10,363.1 |
| 2002 | 9,440.9 | 10,124.3 | 9,846.6 | 9,616.5 | 10,051.3 | 10,505.6 | 10,503.4 | 10,501.5 | 9,946.5 | 10,118.3 | 9,958.4 | 9,896.8 |
| 2003 | 9,047.6 | 8,375.7 | 8,409.6 | 8,848.6 | 9,541.9 | 9,870.5 | 10,290.1 | 9,793.4 | 8,868.3 | 9,589.9 | 9,547.8 | 9,836.5 |
| 2004 | 8,602.2 | 8,512.5 | 8,551.5 | 8,416.9 | 8,059.6 | 8,132.4 | 8,409.9 | 8,479.6 | 8,513.0 | 8,162.9 | 8,142.5 | 8,637.8 |
| 2005 | 7,737.5 | 8,062.5 | 7,810.5 | 7,639.1 | 8,074.6 | 8,525.6 | 7,879.7 | 7,353.1 | 6,381.3 | 6,517.7 | 7,042.5 | 7,080.3 |
| 2006 | 6,153.1 | 6,620.0 | 6,735.5 | 6,379.5 | 6,375.4 | 6,425.0 | 6,405.1 | 6,457.8 | 6,643.7 | 6,826.3 | 6,773.6 | 6,739.8 |
| 2007 | 6,495.6 | 6,694.3 | 6,425.7 | 6,291.6 | 6,552.4 | 6,767.4 | 6,703.3 | 6,952.6 | 6,897.5 | 6,870.7 | 6,389.8 | 6,336.1 |
| 2008 | 6,122.9 | 6,143.9 | 6,117.0 | 6,141.8 | 5,815.2 | 5,615.6 | 5,660.0 | 5,754.4 | 5,596.0 | 5,889.1 | 5,992.4 | 6,309.5 |
| 2009 | 5,752.4 | 5,933.0 | 5,996.3 | 6,284.1 | 6,360.1 | 6,370.9 | 6,530.9 | 6,462.2 | 6,465.5 | 6,396.3 | 6,090.5 | 6,176.0 |
| 2010 | 5,694.7 | 5,513.5 | 6,179.7 | 6,423.6 | 6,734.2 | 6,953.7 | 7,016.2 | 6,816.9 | 6,832.1 | 6,486.5 | 6,386.6 | 6,260.4 |
| 2011 | 5,564.9 | 5,927.0 | 5,837.6 | 5,674.4 | 5,898.1 | 6,292.7 | 6,207.0 | 6,208.3 | 6,164.8 | 6,138.8 | 6,189.1 | 6,434.9 |
| 2012 | 5,438.2 | 5,609.4 | 5,735.9 | 5,649.9 | 6,037.1 | 6,385.6 | 6,208.7 | 6,187.8 | 5,796.8 | 5,686.5 | 5,518.4 | 5,698.4 |
| 2013 | 5,397.8 | 5,441.2 | 5,473.9 | 5,921.5 | 6,065.5 | 6,179.3 | 6,058.9 | 5,973.8 | 5,947.5 | 5,851.8 | 5,794.4 | 5,624.2 |
| 2014 | 5,082.2 | 5,203.6 | 5,369.8 | 5,644.2 | 5,985.7 | 6,009.6 | 5,872.0 | 5,922.0 | 5,901.8 | 5,955.5 | 5,799.1 | 5,815.9 |
| 2015 | 5,745.1 | 6,015.1 | 6,056.1 | 6,485.6 | 6,815.7 | 6,849.3 | 6,908.8 | 6,990.5 | 6,832.1 | 6,736.7 | 6,643.1 | 6,489.7 |
| 2016 | 6,103.5 | 6,573.3 | 6,774.8 | 6,898.5 | 7,040.8 | 7,599.1 | 7,516.2 | 7,431.6 | 7,276.7 | 7,043.5 | 6,903.7 | 6,762.1 |
| 2017 | 6,084.7 | 6,338.0 | 6,569.5 | 6,715.4 | 7,028.9 | 7,365.1 | 7,172.1 | 7,077.9 | 6,438.8 | 6,505.8 | 6,508.8 | 6,419.2 |
| 2018 | 5,999.7 | 6,097.2 | 6,388.8 | 6,542.2 | 6,794.6 | 6,890.0 | 6,808.7 | 6,809.6 | 6,694.9 | 6,519.3 | 6,676.0 | 6,657.0 |
| 2019 | 6,047.5 | 6,145.4 | 6,310.3 | 6,441.4 | 6,756.4 | 6,869.4 | 7,138.2 | 7,244.5 | 7,087.5 | 7,042.1 | 6,986.2 | 6,707.4 |
| 2020 | 6,395.2 | 6,808.0 | 5,539.4 | 3,606.5 | 4,992.3 | 6,357.1 | 6,825.2 | 7,064.2 | 6,965.7 | 6,799.2 | 6,510.3 | 6,252.3 |
| 2021 | 6,005.7 | 5,807.5 | 6,479.7 | 6,751.5 | 7,227.7 | 7,324.1 | 7,369.0 | 7,331.4 | 7,198.4 | 7,079.2 | 6,812.3 | 6,577.5 |
| 2022 | 5,950.7 | 6,381.4 | 5,870.2 | |||||||||
| - = No Data Reported; -- = Not Applicable; NA = Not Available; W = Withheld to avoid disclosure of individual company data. |
| Release Date: 5/19/2022 |
| Next Release Date: TBD |