|
Download Data (XLS File) |
|
||||||||
|
||||||||
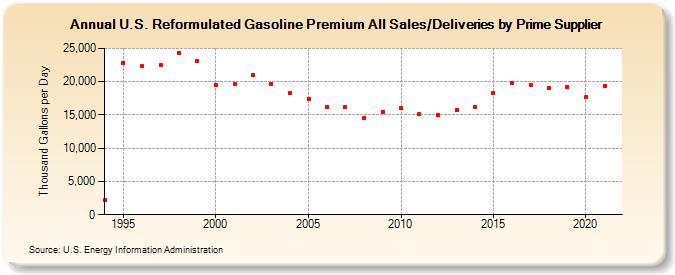
| U.S. Reformulated Gasoline Premium All Sales/Deliveries by Prime Supplier (Thousand Gallons per Day) | ||||||||
| Decade | Year-0 | Year-1 | Year-2 | Year-3 | Year-4 | Year-5 | Year-6 | Year-7 | Year-8 | Year-9 |
|---|---|---|---|---|---|---|---|---|---|---|
| 1990's | 2,223.1 | 22,829.8 | 22,359.3 | 22,488.1 | 24,307.3 | 23,069.6 | ||||
| 2000's | 19,503.9 | 19,603.3 | 21,004.8 | 19,703.2 | 18,234.5 | 17,346.9 | 16,164.9 | 16,204.8 | 14,554.1 | 15,484.4 |
| 2010's | 16,032.4 | 15,087.7 | 15,012.7 | 15,723.7 | 16,247.4 | 18,358.4 | 19,827.6 | 19,537.2 | 19,081.5 | 19,232.7 |
| 2020's | 17,629.8 |
| - = No Data Reported; -- = Not Applicable; NA = Not Available; W = Withheld to avoid disclosure of individual company data. |
| Release Date: 6/1/2022 |
| Next Release Date: TBD |