|
Download Data (XLS File) |
|
||||||||
|
||||||||
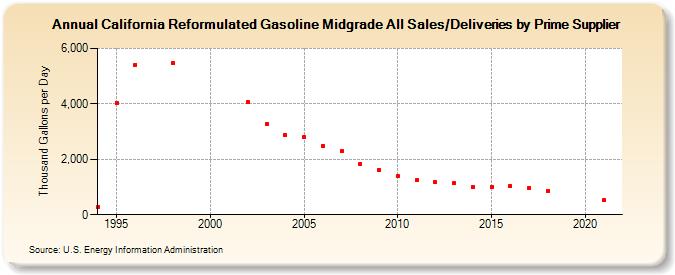
| California Reformulated Gasoline Midgrade All Sales/Deliveries by Prime Supplier (Thousand Gallons per Day) | ||||||||
| Decade | Year-0 | Year-1 | Year-2 | Year-3 | Year-4 | Year-5 | Year-6 | Year-7 | Year-8 | Year-9 |
|---|---|---|---|---|---|---|---|---|---|---|
| 1990's | 289.6 | 4,040.9 | 5,411.3 | W | 5,481.1 | W | ||||
| 2000's | W | W | 4,056.4 | 3,273.0 | 2,866.9 | 2,791.4 | 2,484.8 | 2,300.1 | 1,825.2 | 1,611.9 |
| 2010's | 1,396.1 | 1,240.6 | 1,166.7 | 1,131.9 | 1,007.7 | 1,008.6 | 1,032.1 | 957.5 | 872.5 | W |
| 2020's | W |
| - = No Data Reported; -- = Not Applicable; NA = Not Available; W = Withheld to avoid disclosure of individual company data. |
| Release Date: 6/1/2022 |
| Next Release Date: TBD |